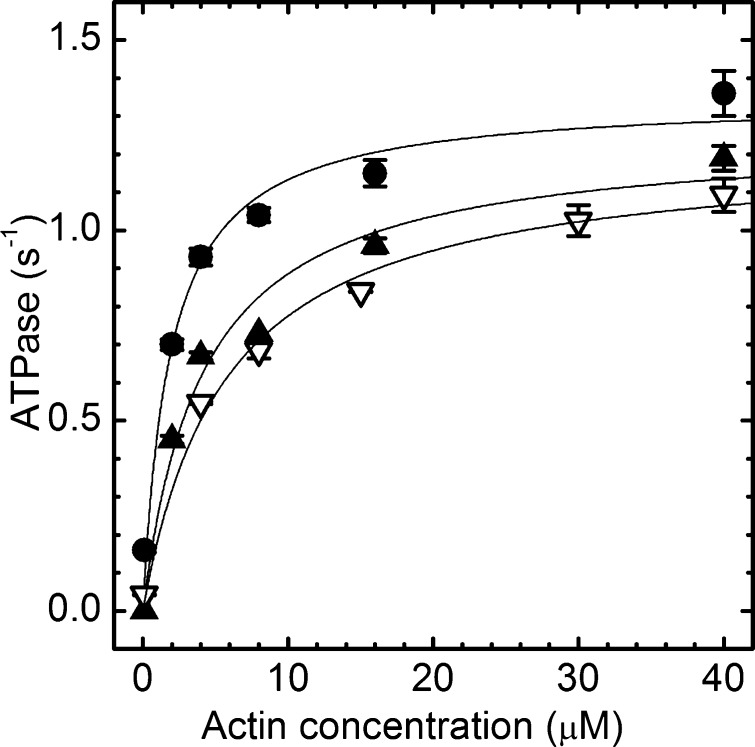
Figure 1.
βMys actin-activated ATPase in the presence of 0.1 μM OM (▲) and 100 μM OM (●) and the control without OM (▽). Solid lines represent fitting curves with ATPase = (Vmax[actin])/(Km + [actin]). Parameter values for the curves are summarized in Table 1. Control βMys actin-activated ATPase had no OM or DMSO. Other conditions had OM and 1% DMSO.

