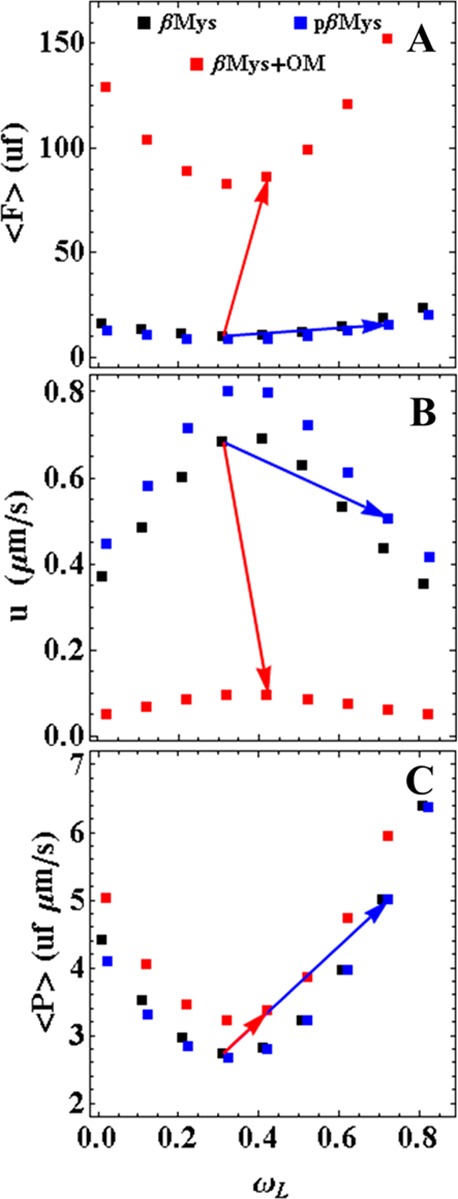
Figure 5.

Qdot assay analytics comparing native (black), phosphorylated (blue), and OM treated (red) βMys. The average force, ⟨F⟩, in units of force [uf and eq 5 (A)], dynamic velocity, u [eq 6 (B)], and average power, ⟨P⟩ [eq 7 (C)], were computed as a function of the relative step-frequency for the long step, ωL, assuming relative step-frequency for the short step, ωS, was constant and taken from Table 1. System optimization calls for maximizing ⟨P⟩ with βMys activation. Panel C shows that maximal ⟨P⟩ occurs for maximal ωL. Activated ⟨P⟩ due to phosphorylation (blue arrow) is larger than activated ⟨P⟩ by OM treatment (red arrow). Blue and red arrows follow the changes in ⟨F⟩ and u due to phosphorylation and OM treatment, respectively. Arrows begin and end on values listed in Table 1.
