Abstract
A proteome-level time-series study of drug effects (i.e., pharmacodynamics) is critical for understanding mechanisms of action and systems pharmacology, but is challenging, because of the requirement of a proteomics method for reliable quantification of many biological samples. Here, we describe a highly reproducible strategy, enabling a global, large-scale investigation of the expression dynamics of corticosteroid-regulated proteins in livers from adrenalectomized rats over 11 time points after drug dosing (0.5–66 h, N = 5/point). The analytical advances include (i) exhaustive tissue extraction with a Polytron/sonication procedure in a detergent cocktail buffer, and a cleanup/digestion procedure providing very consistent protein yields (relative standard deviation (RSD%) of 2.7%–6.4%) and peptide recoveries (4.1–9.0%) across the 60 animals; (ii) an ultrahigh-pressure nano-LC setup with substantially improved temperature stabilization, pump-noise suppression, and programmed interface cleaning, enabling excellent reproducibility for continuous analyses of numerous samples; (iii) separation on a 100-cm-long column (2-μm particles) with high reproducibility for days to enable both in-depth profiling and accurate peptide ion-current match; and (iv) well-controlled ion-current-based quantification. To obtain high-quality quantitative data necessary to describe the 11 time-points protein expression temporal profiles, strict criteria were used to define “quantifiable proteins”. A total of 323 drug-responsive proteins were revealed with confidence, and the time profiles of these proteins provided new insights into the diverse temporal changes of biological cascades associated with hepatic metabolism, response to hormone stimuli, gluconeogenesis, inflammatory responses, and protein translation processes. Most profile changes persisted well after the drug was eliminated. The developed strategy can also be broadly applied in preclinical and clinical research, where the analysis of numerous biological replicates is crucial.
A comprehensive understanding of the mechanisms underlying drug action is indispensable for predicting and evaluating drug efficacy and safety, and for directing therapeutic efforts.1 Conventionally, studies of drug mechanisms of action involve the examination of hypothesized or known targets.2 Despite considerable successes, target-based approaches remain suboptimal in that they are often laborious, time-consuming, and susceptible to bias arising from factors such as unexpected off-target effects and collective effects by multiple targets.3 Genomic approaches offer a powerful tool for nonbiased investigations of drug action,4 but such strategies fall short in that message expression changes may not accurately reflect drug effects on protein level.5,6 In contrast, proteomic approaches are capable of identifying global protein dynamics in response to diverse stimuli and, thus, can provide directly relevant information on altered biological cascades.7,8
A comprehensive and accurate investigation of drug actions require the study of responses over time because many drug-induced biological processes often occur at different times after drug dosing.9 Pharmacodynamics, which is the investigation of the quantitative relationships between drug concentrations and effects over time, provides valuable information on drug potency, toxicity, side effects, and mechanisms of action.10 Performing in vivo pharmacodynamic studies on a proteome level will reveal the temporal features of drug-induced molecular changes and provide rich biological information leading to improved understanding of diverse drug effects.
However, realizing comprehensive pharmacodynamic proteomic studies represents a daunting challenge for several reasons. First, an ideal pharmacodynamic study requires the analysis of many time points after dosing with multiple biological replicates at each time point.10 Although targeted proteomics methods can be applied to the quantification of many biological samples,11,12 accurate and precise proteomic profiling with many biological replicates remain challenging. Recently, developments in isotope-labeling strategies, especially the super-SILAC method,13,14 enabled accurate and large-scale proteomic quantification in some types of human and mouse tissues, but a practical strategy that is readily adaptable to any animal model in a cost-effective manner remains largely elusive. Label-free approaches carry the potential of comparing multiple biological replicates.15 However, as these approaches do not employ any internal standard, highly quantitative and reproducible sample preparation and LC/MS analysis are required but are often difficult to achieve in practice, particularly for large sample cohorts.16 Second, an in-depth proteomic analysis of each animal or clinical subject in the large cohort is desirable for extensive investigation of drug-responsive proteins, but it is difficult to accomplish. Multidimensional chromatography can greatly enhance proteome coverage,17 but it is not practical for quantification of many biological samples (e.g., >20) with the requisite quantitative accuracy and precision.18 Previously, several excellent works showed that one-dimensional liquid chromatography/mass spectroscopy (1-D LC/MS) analysis using a long reverse-phase column and a shallow gradient can provide extensive separation of complex proteomes and good reproducibility has been demonstrated with a handful of runs,19−23 but the reproducibility for many biological samples has not been evaluated yet (e.g., >30). Because of these technical difficulties, studies of drug-induced proteomic changes have been limited to three time points,24,25 which is often not sufficient for pharmaceutical studies.
Recently, we developed an extensive ion-current-based strategy that is capable of profiling 10–20 replicates in one experimental set.7,26,27 To enable the proteomic comparison of a much larger number of biological samples, in this study, we developed several technical advances that substantially enhance the efficiency and reproducibility of sample preparation, digestion and LC/MS analysis, extent of peptide separation, and reliability of ion current-based quantification.
This strategy was applied to a large-scale study of the protein dynamics induced by the immunosuppressive drug methylprednisolone (MPL) in rat liver. MPL is a corticosteroid (CS) used for the treatment of chronic inflammatory and autoimmune diseases.28 The CS drugs have long-term adverse effects such as diabetes, myopathy, and osteoporosis,28 and the mechanisms underlying therapeutic and adverse side effects are complex.29 We performed diverse studies of CS-induced transcriptional changes,30,31 which revealed complex patterns of mRNA regulation. A proteomic-scale investigation of the pharmacodynamics of CS will greatly extend our knowledge of the biological cascades responsible for their effects.
Experimental Section
Dosing of Animals
Details for animal dosing are described in the Supporting Information.
Extraction of Tissues and Precipitation/On-Pellet Digestion
Livers were ground to fine powder under liquid nitrogen and 80 mg of the powder was suspended in 800 μL of detergent-cocktail lysis buffer, which contained 150 mM sodium chloride, 1% sodium deoxycholate, 2% Nonidet P-40 (NP-40), and 2.5% sodium dodecyl sulfate (SDS) and protease inhibitors (Complete tablets, EDTA-free, Roche, Inc.). The mixtures were immediately homogenized on ice using a Polytron homogenizer (Kinematica, Switzerland) at 15 000 rpm for six cycles, each with 10-s bursts and 5-s pause times. The samples were then sonicated using a high-energy sonicator (Qsonica, Newtown, CT) at 30-s bursts on ice for six cycles. The extract was centrifuged at 20 000 g for 60 min at 4 °C. Several aliquots were collected from the supernatant. Total protein contents were measured by the Bicinchoninic Acid Assay. Then, 100 μg of protein were diluted with the lysis buffer to a final concentration of 2 mg/mL, which subjected to a precipitation/on-pellet-digestion procedure. Details are presented in the Supporting Information.
Precipitation/on-pellet-digestion of the 60 samples was carried out in 3 cohorts (20 samples per cohort) to minimize the effect of peptide degradation over the 20-day analysis.
Nanoflow, Reverse-Phase LC/MS
The Nano Flow Ultrahigh Pressure LC system (nano-UPLC) consisted of a Spark Endurance autosampler (Emmen, Holland) and an ultrahigh pressure Eksigent (Dublin, CA) Nano-2D Ultra capillary/nano-LC system. To achieve an extensive and reproducible separation of the complex peptide mixture, a nano-LC/nanospray setup that was devised in house, illustrated in Figure S1 in the Supporting Information, was employed. The following features were utilized to enable excellent chromatographic resolution and run-to-run reproducibility:
(i) Separation on a long column (100 cm long and 50-μm inner diameter (ID)) with small particles (Pepmap 2-μm C18, 100 Å) under high pressure (∼9000–11 000 psi with heating).
(ii) A unique packing procedure for excellent durability. The sorbent flurry was packed three cycles per direction; for each cycle, the packing pressure was ∼12 000 psi at 24 °C for 1 h, followed by controlled gradient venting for 8 h under constant temperature and humidity. High-pressure, 0.5 mm frits (High-Pressure-Frits, patent pending) were placed at both ends to constrain the packed sorbent. Upon completion of packing, a laser tip puller (Sutter Instruments) was used to produce a ∼2-μm noncoated tip with the fused frit inside.
(iii) The direct trap-column connection without extra in-valve volume improves peak shapes and reduces tailing.
(iv) To achieve a highly homogeneous heating, the column was folded in a heating sheath fully filled with heat-conductive silicone.
(v) A large trap-vs-column ID ratio (6:1) was employed for substantially dampened pump delivery variation and improved gradient mixing on nanoflow scale.
(vi) Between each two runs, the noncoated tip of the fused silica column was subjected to a programmed washing for 10 min (350 μL/min), using 50% methanol and 0.1% formic acid, with a syringe pump triggered by a contact closure signal sent from the Spark autosampler, prior to the start of the nano-LC gradient. Before analysis of the large number of time-course samples, the newly packed column was “aged” by triplicate runs of a pooled liver digest sample for ∼21 h.
Details on the 7-h gradient and MS parameters (Orbitrap) are given in the Supporting Information.
Protein Identification and Ion-Current-Based Quantification
Details on database searching, protein identification, and ion-current-based quantification are specified in the Supporting Information.
Results and Discussion
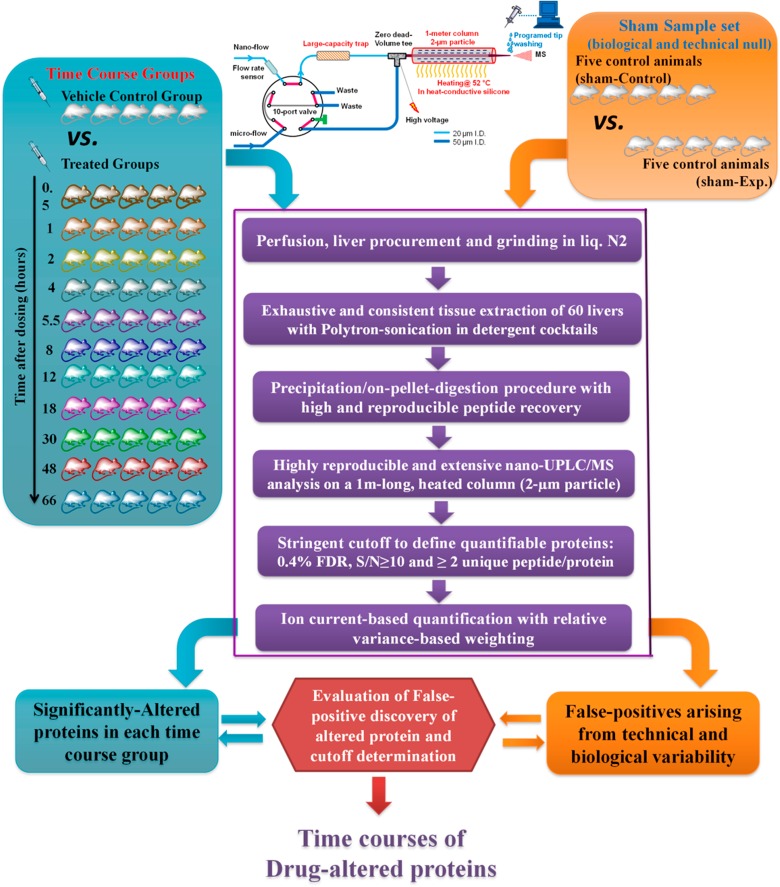
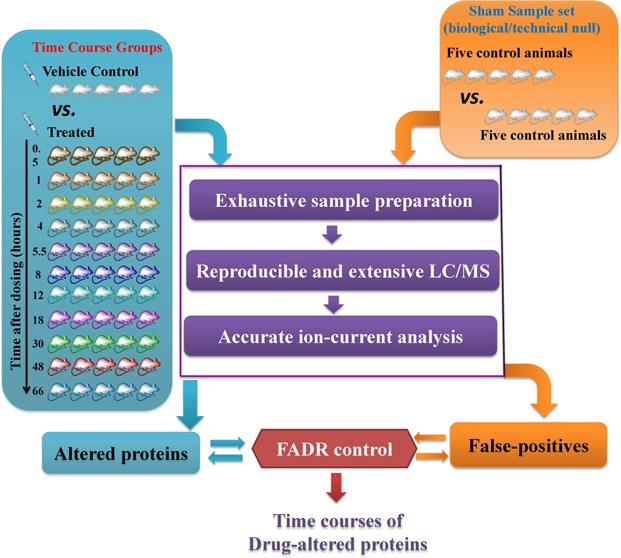
To enable an accurate and extensive assessment of the expression dynamics of drug-induced proteomic changes, this study developed a robust and reproducible ion-current-based quantitative approach that enables the reliable profiling of a large number of animals in one set. The schematic of the procedures and the experimental design are illustrated in Figure 1.
Figure 1.
Experimental procedure for the large-scale, ion-current-based proteomic profiling. The ADX rats were dosed with 50 mg/kg methylprednisolone (MPL) (11 time-course groups) or saline (1 vehicle-control group). A multiplex, reproducible and extensive ion-current-based strategy was developed and evaluated for quantification in all animals. To determine the proper cutoff thresholds for discovery, the false altered protein discovery in each time-course group was estimated by comparison with a sham sample set (5 controls vs 5 controls).
Highly Reproducible Approaches for Preparation of a Large Number of Tissue Samples
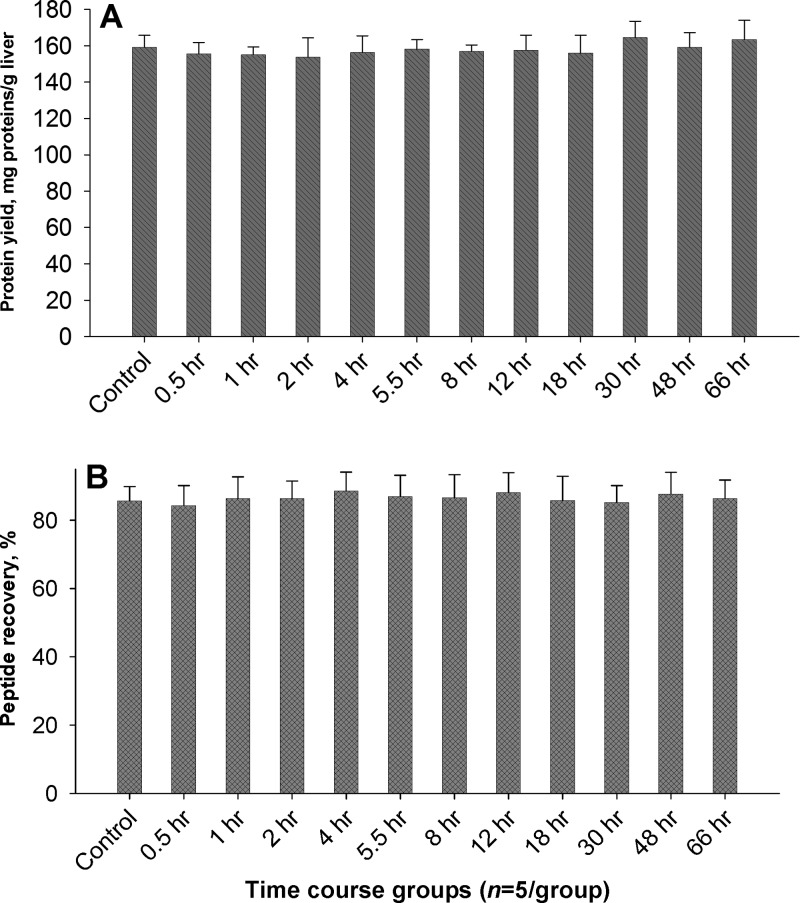
Complete and uniform extraction of the proteins across the 60 liver samples is essential for this study but challenging with existing protocols. The extraction, cleanup, and digestion procedure developed here achieved near-complete extraction of liver tissues with exceptional intersample reproducibility. Perfused livers were ground to fine powder in liquid nitrogen, and then lysed with a Polytron homogenizer in a detergent cocktail, followed by extensive extraction with sonication (see the Experimental Section), which afforded complete disruption of tissue structures and components. The optimal buffer compositions were experimentally identified based on the evaluation of extraction consistency and efficiency from rat livers, with consideration that all buffer components can be completely removed later in the precipitation step. An extraction buffer containing 2% NP-40, 2.5% SDS, and 1% sodium deoxycholate was determined to be optimal. The mixture of ionic and nonionic detergents permits exhaustive extraction of the membrane proteins as well as cytosolic proteins in tissue.32 High and consistent protein yields at an average of 161.25 mg per gram of liver tissue, with 2.7%–6.4% intragroup variation and 5.0% intergroup variation were achieved across the 12 groups of animals (Figure 2A). The completeness of extraction was confirmed by measuring the protein content in the pellet remnants after extraction, where only <0.3% of total protein was found. The combination of Polytron homogenization and sonication greatly enhanced the protein yields and reproducibility of extraction, compared to using the homogenization alone for the same samples in the same buffer, which resulted in protein yields at ∼118.7 mg/g with >21% intergroup variations. The sonication not only improves extraction efficiency and reproducibility, but also breaks large-molecule nucleic acids into small fragments that can be removed by subsequent precipitation steps.
Figure 2.
Efficient and reproducible extraction and sample preparation for the 60 animals. (A) Protein extraction yields from liver samples using a unique Polytron/sonication protocol with a cocktail of high-concentration of detergents. (B) The peptide recovery of the precipitation/on-pellet-digestion procedure. Peptide recovery was determined by a modified BCA method described previously.32
The composition of organic solvents used for precipitation was experimentally optimized. As confirmed by a triple-quadruple LC/MS analysis, the optimized precipitation approach using acetone/chloroform/formic acid mixture (see the Supporting Information) effectively removed all the detergents that would otherwise severely compromise the subsequent digestion and LC/MS analysis (>99.98%, data not shown), while providing high protein recoveries. It was found that dilution of the liver extract to the protein concentration range of 0.5–3 mg/mL with the lysis buffer before precipitation was critical to maintain high protein recoveries. The optimized stepwise precipitation procedure resulted in high protein recovery (92%–97% across the 60 animals). Moreover, the procedure also significantly reduced nonprotein matrix components such as lipids and fragmented/small-molecule nucleic acids, which may otherwise negatively affect the robustness and consistency of nano-LC/MS analysis. After precipitation, we employed an on-pellet-digestion approach32 without dissolving the protein pellet (which often requires denaturing reagents that may negatively impact analytical reproducibility). Under active agitation, a short phase-I digestion brings the pellets into solution by cleaving the pelleted proteins into soluble albeit large tryptic peptides; these incompletely cleaved peptides were then subjected to an overnight phase-II digestion, which achieved complete cleavage. This straightforward precipitation/on-pellet-digestion procedure resulted in high and reproducible peptide recoveries in the range of 84%–89% with a relative standard deviation (RSD%) of 4.1%–9% across the 12 groups of rats (n = 5 per group, Figure 2B). The data in Figure 2 demonstrated that the developed sample preparation strategy is sufficiently quantitative and reproducible for the 60 samples, which laid a solid foundation for ion-current-based quantification.
A Reproducible and Extensive Nano-LC/MS Strategy Capable of Reliable Quantification of Numerous Samples
To address the challenging requirement for reliable and precise relative quantification of the 60 samples, we developed several approaches enabling high reproducibility, sensitivity, and chromatographic resolution of the ultrahigh-pressure nano-LC/MS analysis, by substantially improving procedures that we described previously.7,26 The detailed flow path setup is illustrated in Figure S1 in the Supporting Information and specified in the Experimental Section. Compared with a more “conventional” nano-LC/MS setup with shorter gradient/column, this strategy has the following salient advantages.
High-Resolution Chromatographic Separation
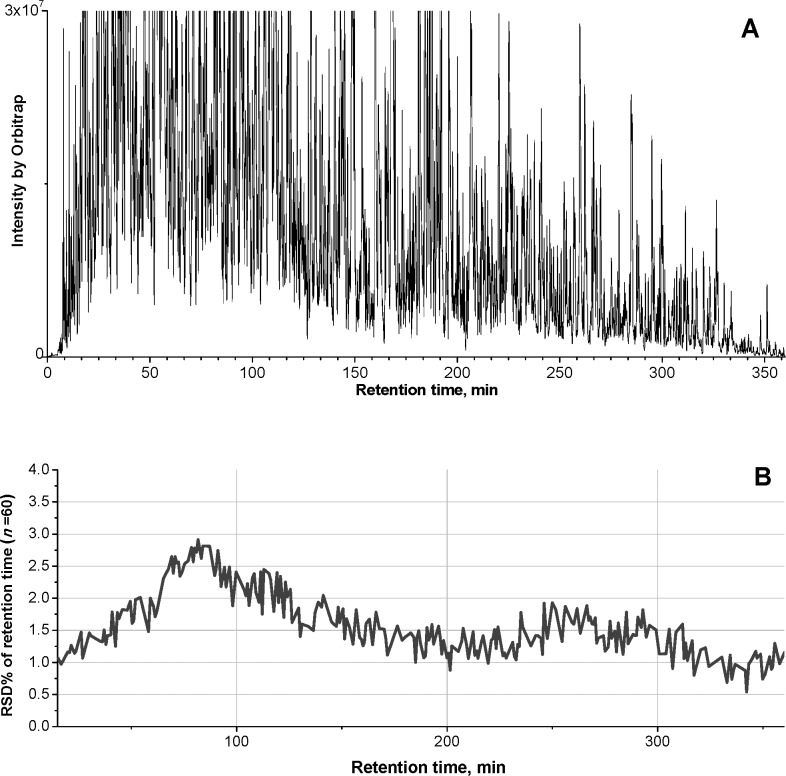
Extensive and high-resolution separation of the liver digests was achieved on a 100-cm-long column packed with 2-μm particles and having a 7-h gradient. The low-void-volume design significantly improved peak shapes and reduced tailing. Because of the retrograde loading-analysis directions and the peak compression effect achieved by using slightly weaker stationary phase in the trap than in the column (Figure S1 in the Supporting Information), the large-ID trap did not lead to perceivable band-broadening. An elevated separation temperature was found to improve chromatographic resolution, as expressed by the average of 38% reduced peak widths (fwhm) of relative polar peptides in the rat liver digest (i.e., the peptides eluted in the first ∼125 min). Figure 3A shows a representative base peak chromatogram for the analysis of rat liver digests under the optimized nano-LC/MS conditions. An extended peptide elution window of ∼360 min and a peak capacity of >1390 (the length of peptide elution window divided by the average peak width at 4σ, 13.4% peak height) were achieved. The high extent of separation (6-h peptide elution window with narrow peaks) on this system resulted in 3.2-fold greater numbers of quantifiable proteins than using a 25-cm column packed with the same material with a 1.5-h gradient (data not shown). Moreover, our study showed that an extensive chromatographic separation also substantially improved the match of peptide ion currents among different samples, by providing sufficient chromatographic resolution among peptides with close m/z. For example, a 146% increase of successfully matched quantitative frames and a 58% decrease in missing data in individual replicates were observed using the 100-cm-long column with a 7-h gradient, over that using a 25-cm column with a 1.5-h gradient.
Figure 3.
The extensive and reproducible separation of rat liver digests. (A) A representative base peak chromatogram for separation of liver digest. (B) Variation (RSD%) of the retention times of base peak peptides across 60 consecutive runs of a pooled liver digest, over a 18-day period. The nano-LC/MS configuration was shown in Figure S1 in the Supporting Information, and the separation was carried out on a 100-cm-long nano column (50-μm ID and packed with 2-μm C18 particles) heated at 52 °C. The extensive separation permits extensive analysis and accurate match of peptide peaks, which is critical for the ion-current-based quantification.
High Analytical Reproducibility among Many Runs
It has been previously demonstrated that the use of a long column/gradient enables extensive 1-D LC/MS analysis of complex proteomes.19−22,33 Our pilot study found it very challenging to achieve the high run-to-run reproducibility using a trapless, conventional long column/gradient approach for the analysis of many tissue samples, e.g., the coefficient of variation (CV%) of retention time and area-under-the-curve (AUC) increased to >7% and >26%, respectively, after nine consecutive runs (data not shown) . This problem can be attributed to the buildup of residual matrix components in the LC/MS system and the difficulties in stabilizing the long-column-LC/MS system for an extended period of time (e.g., >10 days). Here, we developed technical advances providing exceptional run-to-run reproducibility, in terms of both retention times and AUC of peptide precursor ions. These advances include the following:
(i) An improved column packing procedure and high-pressure frits at both ends, which helps to achieve consistent column performance over a 20-day period, after one-day “aging” runs with tissue samples (see the Experimental Section);
(ii) The large-capacity trap prevents hydrophobic and hydrophilic matrix components from entering the nano-LC/MS system, eliminating the need of offline sample cleaning, one major source of compromised reproducibility for label-free quantification; the trap also provided pump noise dampening and optimal gradient mixing;32
(iii) The separation was carried out with a homogeneous heating of the long silica column by immersing it in a heat-conductive-silicone filled, well-insulated heating sheath, which markedly improved run-to-run repeatability, compared to using a standard column oven; and
(iv) A programmed, effective washing of the spray tip between two runs using a software-controlled syringe pump (see the Experimental Section) was found to result in a highly constant ionization efficiency and MS signal responses across >60 consecutive runs.
We evaluated the reproducibility of LC/MS analysis of liver digests by 60 repetitive runs of a pooled sample. The RSD% values of the retention times of peptide base peaks ranged from 0.6% to 2.8% (Figure 3B). Furthermore, to estimate the run-to-run reproducibility of peptide ion current AUC, 15 representative peptides that were randomly selected within each 20 min segment of the elution window were evaluated. Over the 60 replicate runs, low variations of AUC of proteins, in the range of 3.9%–16.8% (RSD%) with a mean of 9.4%, were observed. Finally, using the ion-current-based quantitative method, >98% of the proteins (1594 out of 1622 quantified) exhibited no missing data at the protein level in any of the replicates.
High Analytical Sensitivity
The developed nano-LC/MS approach provides improved analytical sensitivity, which is important for ion-current-based quantification of low-abundance peptides. With a long, shallow gradient elution, the loading capacity of the system is mainly determined by the trap capacity, rather than the nanocolumn.26 Our pilot studies indicated that up to 8 μg of liver digest can be loaded onto the system without compromising the chromatographic resolutions and quantitative linearity, even for the most hydrophilic peptides (e.g., those eluted in the first 10 min of the elution window). Based on this result, the optimal loading capacity was 6 μg of liver digest, which is 5–10-fold higher than using a trap-less configuration. The 6 μg loading resulted in a >25% increase in quantifiable proteins over the standard loading of 1 μg without a trap, as shown in Figure S2 in the Supporting Information. Furthermore, we overfilled the Orbitrap analyzer to further improve the signal-to-noise ratio (S/N) of the peptide precursors. Because of the unique feature of its electric fields, the Orbitrap analyzer is much less prone to space-charge effects than most other types of MS analyzers.34 Therefore, it is feasible to overfill the Orbitrap with large numbers of charges, which will produce more-intensive image currents and thus improve the S/N of peptides. Previously, we demonstrated that overfilling an Orbitrap achieved markedly improved analytical sensitivity without compromising mass accuracy and resolution, when the analyzer was properly calibrated under the target high Automatic Gain Control (AGC) values.32,35,36 Here, we optimized the Orbitrap overfilling conditions using rat liver digests. Under the optimal conditions (see the Experimental Section), an average 6-fold improvement in S/N was achieved over the manufacturer-suggested values, with an average mass error of constantly <5 ppm over a 10-day evaluation.
Well-Controlled Ion-Current-Based Quantification
A well-controlled ion-current-based quantification was conducted. Technical details on ion-current-based quantification can be found in a previous publication.37 The parameters for peak alignment, peptide ion match, and frame generation were identified by analyzing a benchmark dataset containing the repetitive runs of a pooled tissue sample. To ensure high quantitative accuracy and precision, strict criteria were applied for peak detection and frame generation, e.g., S/N > 10 for peptide precursor peaks and the elimination of peptides with ambiguous assignment, so that only qualified frames were used for quantification. Because of the reproducible and efficient sample preparation and LC/MS analysis, high intersample reproducibility was achieved, as expressed by excellent SIEVE alignment scores (0.82–0.88, with 1.0 being the maximum) across the 60 time-course samples. Approximately 120 000 quantitative frames were generated. The AUC data was interfaced to a PHP script, which transformed the quantitative data, followed by normalization for each individual sample. The protein ratios of time-course groups versus vehicle controls were computed by aggregating the AUC data on peptide levels to protein levels using a weighting model based on relative variances, as detailed in the Supporting Information.
Pharmacodynamic studies require accurate and precise quantitative data across all time points. To achieve this, a set of highly stringent cutoff criteria were employed to define the “quantifiable proteins”, so that only proteins with high-quality AUC data and confident identification were considered. These include (i) high cutoff criteria for peptide identification that resulted in a peptide FDR of 0.4%; (ii) strict criteria for peak detection and frame generation (e.g., S/N > 10); and (iii) the fact that each quantifiable protein was required to have at least two independent sets of qualified AUC data, each from a unique peptide that met both criteria (i) and (ii). Under these criteria, 1753 unique protein groups (out of ∼3000 identified) were quantified with high confidence across the time points. The detailed quantitative data on both protein and peptide levels are shown in Table S1 in the Supporting Information. Considering the very stringent criteria, the fact that the quantitative assessments were carried out in each of the 60 biological replicates and that the reviewed rat protein database is currently incomplete, this study achieved relatively extensive proteomic quantification.
To determine the proper cutoff thresholds for the discovery of significantly altered proteins, the false-positive discovery of significantly altered proteins was evaluated and controlled using an experimental strategy. Briefly, 10 vehicle-control animal tissue samples were used to constitute the “sham sample set”; among these, 5 were randomly designated as the “sham-experimental samples” with the other 5 as “sham-control samples”. The sham samples were prepared and analyzed by LC/MS in a sequence randomly interspaced with the time-course samples, using exactly the same experimental procedures (Figure 1). Obviously, the “significantly altered proteins” discovered in the sham set, which is actually an “experimentally null” sample set, reflect false-positives arising from technical and biological variability. The false altered-protein discovery rate (FADR) in one time-course group was calculated as the ratio of the number of significantly altered proteins discovered in the sham sample set over that in the time-course sample set, under the same cutoff thresholds (i.e., p-values and fold changes). We evaluated the FADR in all time-course groups under various cutoff thresholds. Finally, a global cutoff criteria of ∼50% change and p < 0.05 (time-course versus control groups) were determined to be optimal. Under these criteria, a total of 323 proteins were significantly altered for at least one time point, with the FADR ranging 1.1–8.2% across the 11 time sample sets. Representative volcano plots are shown in Figure S3 in the Supporting Information.
The heat map for the time course of the 323 altered proteins is shown in Figure 4. A detailed heat map with the names of all altered proteins is shown in Figure S4 in the Supporting Information. The changes at the peptide level agreed well with those at the protein level. For significantly elevated proteins, >95% of peptides are elevated; a similar trend was also observed for decreased proteins (Figure S5 in the Supporting Information). The most prominent drug-induced change is the up-regulation of metallothionein (∼100-fold; see Figure S6 in the Supporting Information), which is a key protein in metal ion homeostasis. This observation is in excellent agreement with previous observations at the transcriptional level.38
Figure 4.
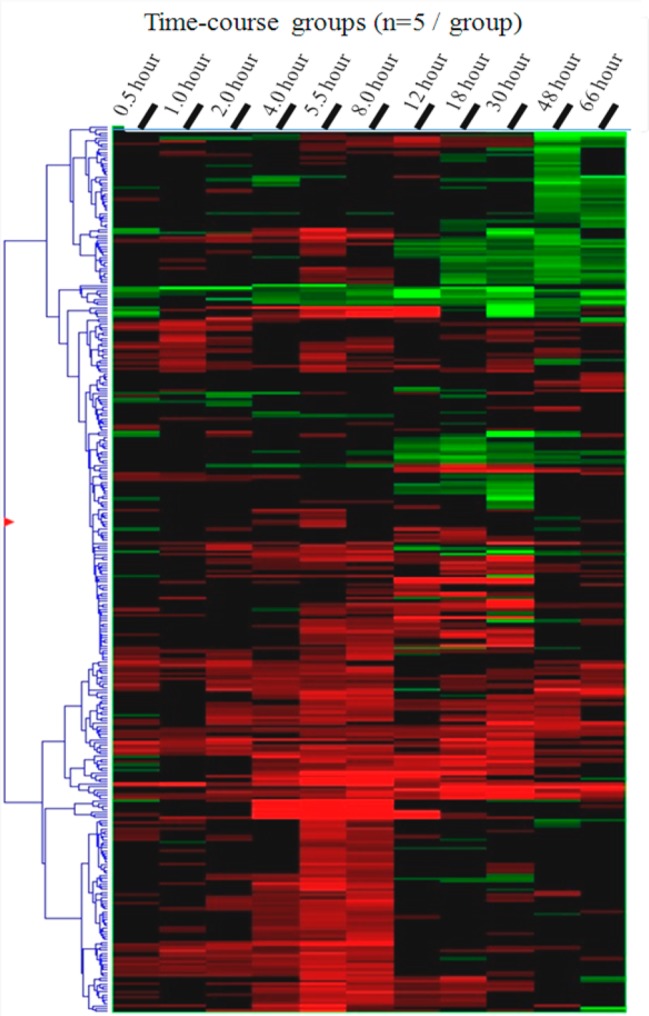
Heat map of the 323 proteins significantly altered at one or more time points. Red and green rectangles represent significant up- or down- regulations, respectively, while the black color denotes that no significant change was found.
Gene Ontology Annotations and Temporal Changes in Biological Processes
Among quantifiable proteins, 26% are associated with membrane components, indicating excellent recovery of membrane proteins by the sample preparation method (Figure S7 in the Supporting Information). The distributions of cellular locations and biological processes of drug-altered proteins are shown in Figures 5A and 5B. The percentages of the significantly altered proteins vary noticeably among different cellular components, reflecting the known fact that corticosteroids (CSs) regulate numerous signaling and metabolism pathways in specific cellular locations (see the“Results and Discussion” section in the Supporting Information). For all time courses, little or no response was observed at very early time points (e.g., 0.5 and 1 h), followed by increases and then decays in the protein concentrations over the 66-h period post-dosing. MPL elicited sustained changes of proteins in “response to hormone stimulus” (Figure 5C); the observed altered proteins in “gluconeogenesis” were all up-regulated, peaking at 8 h (Figure 5D); most of the altered proteins in the “inflammatory/anti-inflammatory response” category were up-regulated and peaked at 12 h, as shown in Figure 5E. These are among the acute response proteins up-regulated by CS as part of their anti-inflammatory response.39 The majority of proteins related to translation were up-regulated, sharply increased, and peaked at 5.5 h, followed by a decline (Figure 5F), in agreement with the anabolic actions of CS in liver.40 Interestingly, the temporal characteristics, such as the peak times and the rates of decline, are quite distinct among various biological processes, reflecting diverse regulatory mechanisms and dynamics. Detailed discussions are in the“Results and Discussion” section in the Supporting Information.
Figure 5.
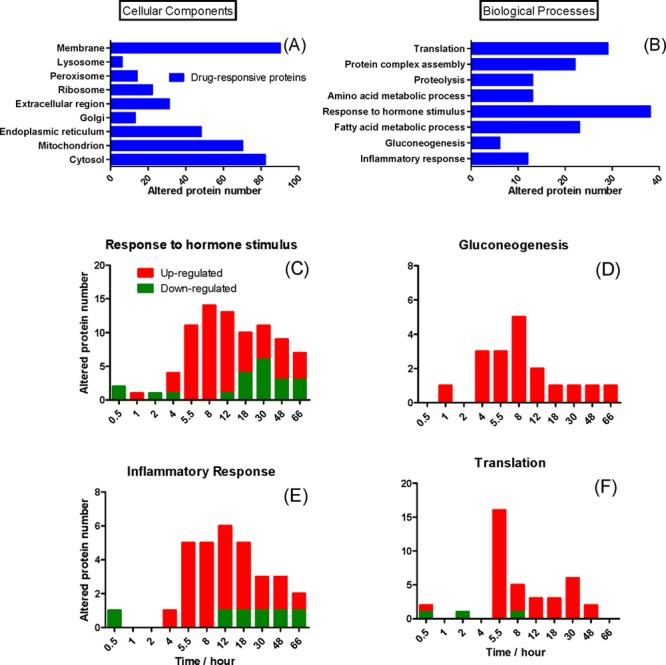
Gene ontology annotation of significantly altered proteins. The distributions of the altered proteins by (A) cellular components and (B) biological processes. Representative time courses of the number of changed proteins are shown in panels (C)–(F). The up- and down- regulated proteins are denoted in red and green, respectively.
Drug-Responsive Proteins in Hepatic Amino Acid Metabolism, Gluconeogenesis, and Acute Phase Response
Previously, systematic investigations of drug responses were mostly on enzyme activity and transcriptional levels but rarely on multiple protein levels, because of the technical limitations. The method developed here enables comprehensive time series studies of protein-level changes underlying drug effects. Although the plasma level of the drug decreased to <1% of peak concentration at 5.5 h,41 temporal proteomics data showed that many biological cascades remained active well after the drug was cleared from the system. Investigation of the biological functions of the discovered drug-responsive proteins is our future plan; however, some key drug-responsive proteins involved in hepatic amino acid metabolism and gluconeogenesis are exemplified here.
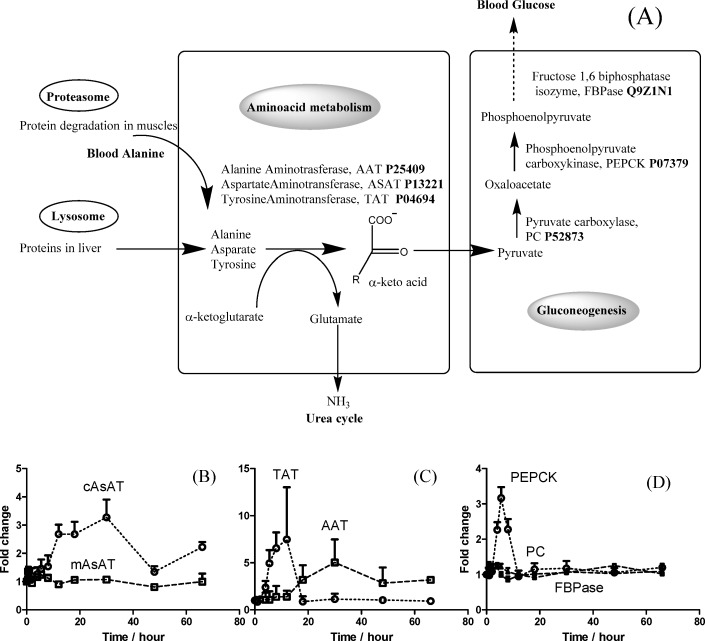
The CS-induced protein degradation, as illustrated in Figure 6A, provides the substrate for amino acid metabolism and gluconeogenesis.42 The time courses of three CS-responsive aminotransferases found in this study (alanine aminotranferase, cytosolic aspartate aminotransferase, and tyrosine aminotransferase) are shown in Figures 6B and 6C. Although all three enzymes can be up-regulated by CS-induced GR binding,43 they exhibited distinct time profiles, reflecting the complex biochemical and dynamic features of the regulation of these proteins in liver. One potential explanation could be found in the differential turnover rates of these proteins, e.g., cASAT has a much longer half-life (5–11 days) than TAT (∼4 h),44 which may account for the much wider response window of cASAT. Furthermore, in contrast to cASAT, the proteomic data showed no significant increase of mASAT, which is consistent with previous reports that cASAT is responsive to CS while mASAT is not.44 Hepatic gluconeogenesis is downstream of amino acid metabolism (Figure 6A); we found that phosphoenolpyruvatecarboxykinase, which is the rate-limiting enzyme in gluconeogenesis, was induced but not pyruvate carboxylase or fructose 2,6-bisphosphate (Figure 6D), which agree with previous observations on observations on mRNA45 and enzyme activity levels. Detailed discussions are given in the“Results and Discussion” section in the Supporting Information.
Figure 6.
Time series changes of hepatic metabolism. Panel (A) shows a simplified scheme for the hepatic metabolism pathways altered by MPL involving protein degradation, amino acid metabolism, and gluconeogenesis. The temporal profiles for the key proteins involved in amino acid metabolism, including cytosolic aspartate aminotransferase (cASAT), tyrosine aminotransferase (TAT), and alanine aminotransferase (AAT), are shown in panels (B) and (C). The profiles for key proteins involved in gluconeogenesis, pyruvate carboxylase (PC), phosphoenol pyruvate carboxykinase (PEPCK), and fructose 1,6-biphosphataseisozyme (FBPase) are shown in panel (D).
Among the significantly up-regulated proteins in inflammatory responses, seven acute phase response proteins were induced by the drug. The increase of these proteins may play a significant role in tissue and organ protection, in response to diverse stimuli, and it is supported by evidence on mRNA level and the reduction of white blood cells after MPL dosing.46 Discussions are in the “Results and Discussion” section in the Supporting Information.
Conclusions
A multiplexed, reproducible, and well-controlled strategy capable of large-scale proteomic investigation was developed. Several technical advances enabled highly reproducible extraction, preparation, and LC/MS analysis, and thus permitting reliable quantification of liver samples from 60 rats. The particular advances include the following:
(i) An efficient and consistent tissue extraction with a Polytron/sonication in a cocktail of high-concentration detergents, followed by a cleanup/digestion procedure that is fully compatible with the extraction method and provides highly reproducible protein and peptide recovery among many tissue samples;
(ii) Substantial improvements of temperature stabilization, pump-noise suppression, and programmed interface cleaning, which permitted high LC/MS reproducibility across continuous analysis of tissue samples for >20 days; this is the key enabling factor that allowed reliable relative quantification in the 60 liver samples;
(iii) The extensive chromatographic separation enabled in-depth profiling of the liver proteome and enhanced the analysis of drug-responsive proteins; and
(iv) Well-controlled ion current-based quantification.
In addition, false-positive discovery of drug-responsive proteins arising from both technical and biological variability was evaluated and controlled by estimating the null distribution using an experimental method. This approach permitted the reliable discovery and quantification of drug-responsive proteins in 5 replicates from 11 different time point groups. The ion-current-based strategy developed herein is straightforward, low cost, and has a low level of missing data.37
This strategy was applied in the investigation of the protein expression dynamics induced by MPL, using 60 animals and 11 time points. To our knowledge, this study represents the most comprehensive investigation of drug-induced protein dynamics on a proteomics level. Under a highly stringent set of cutoff criteria, the time courses of a cohort of drug-responsive proteins were obtained. These molecular changes are implicated in multiple biological and physiological functions, such as hepatic metabolism, inflammatory responses, and translation. Interesting temporal features of proteins involved in amino acid metabolism, gluconeogenesis, and acute phase response were demonstrated. The majority of profiles were found to remain active well after the drug was eliminated, and most of the observed CS-induced changes had not been observed at protein levels before this study.
Moreover and beyond this, the proteomic strategy can be applied broadly in preclinical and clinical studies of disease progression and pharmacology where the analysis of a large number of biological replicates is necessary, and the highly reproducible sample extraction, cleanup and digestion methods are also valuable for most isotope-tagging methods.
Acknowledgments
This work was supported, in part, by the National Institutes of Health (NIH) (Grant Nos. GM24211 (W.J.J.), U54HD071594 (W.J.J. and J.Q.), DA027528 (J.Q.), AI060260 (J.Q.), HD075363 (J.Q.), and HL103411 (J.Q.)). This work was also supposed by the Center for Protein Therapeutics (J.Q.) and the American Heart Association (AHA) (through Award No. 12SDG9450036 (J.Q.)).
Supporting Information Available
This material is available free of charge via the Internet at http://pubs.acs.org.
Author Contributions
∇ These authors contributed equally to this work.
The authors declare no competing financial interest.
Funding Statement
National Institutes of Health, United States
Supplementary Material
References
- Nowatzke W.; Cole T. G.; Bowsher R. R. Bioanalysis 2010, 2, 237–247. [DOI] [PubMed] [Google Scholar]
- Riggs B. L.; Hartmann L. C. N. Engl. J. Med. 2003, 348, 618–629. [DOI] [PubMed] [Google Scholar]
- Muroi M.; Kazami S.; Noda K.; Kondo H.; Takayama H.; Kawatani M.; Usui T.; Osada H. Chem. Biol. 2010, 17, 460–470. [DOI] [PubMed] [Google Scholar]
- Bild A. H.; Yao G.; Chang J. T.; Wang Q.; Potti A.; Chasse D.; Joshi M. B.; Harpole D.; Lancaster J. M.; Berchuck A.; Olson J. A. Jr.; Marks J. R.; Dressman H. K.; West M.; Nevins J. R. Nature 2006, 439, 353–357. [DOI] [PubMed] [Google Scholar]
- Nishizuka S.; Chen S.-T.; Gwadry F. G.; Alexander J.; Major S. M.; Scherf U.; Reinhold W. C.; Waltham M.; Charboneau L.; Young L.; Bussey K. J.; Kim S.; Lababidi S.; Lee J. K.; Pittaluga S.; Scudiero D. A.; Sausville E. A.; Munson P. J.; Petricoin E. F.; Liotta L. A.; Hewitt S. M.; Raffeld M.; Weinstein J. N. Cancer Res. 2003, 63, 5243–5250. [PubMed] [Google Scholar]
- Shankavaram U. T.; Reinhold W. C.; Nishizuka S.; Major S.; Morita D.; Chary K. K.; Reimers M. A.; Scherf U.; Kahn A.; Dolginow D.; Cossman J.; Kaldjian E. P.; Scudiero D. A.; Petricoin E.; Liotta L.; Lee J. K.; Weinstein J. N. Mol. Cancer Ther. 2007, 6, 820–832. [DOI] [PubMed] [Google Scholar]
- Tu C.; Li J.; Bu Y.; Hangauer D.; Qu J. J. Proteomics 2012, 77, 187–201. [DOI] [PMC free article] [PubMed] [Google Scholar]
- Mann M. J. Proteome Res. 2008, 7, 3065–3065. [DOI] [PubMed] [Google Scholar]
- Almon R. R.; DuBois D. C.; Piel W. H.; Jusko W. J. Pharmacogenomics 2004, 5, 525–552. [DOI] [PMC free article] [PubMed] [Google Scholar]
- Mager D. E.; Wyska E.; Jusko W. J. Drug Metab. Dispos. 2003, 31, 510–518. [DOI] [PubMed] [Google Scholar]
- Xiao Y.; Guo L.; Wang Y. Mol. Cell. Proteomics 2014, 13, 1065–1075. [DOI] [PMC free article] [PubMed] [Google Scholar]
- Stastna M.; Van Eyk J. E. Proteomics Clin. Appl. 2012, 6, 547–547. [DOI] [PubMed] [Google Scholar]
- Geiger T.; Wisniewski J. R.; Cox J.; Zanivan S.; Kruger M.; Ishihama Y.; Mann M. Nat. Protoc. 2011, 6, 147–157. [DOI] [PubMed] [Google Scholar]
- Kim J. S.; Fillmore T. L.; Liu T.; Robinson E.; Hossain M.; Champion B. L.; Moore R. J.; Camp D. G.; Smith R. D.; Qian W.-J.. Mol. Cell. Proteomics 2011, 10, M110.007302 (DOI: 10.1074/mcp.M110.007302). [DOI] [PMC free article] [PubMed] [Google Scholar]
- Zhou J. Y.; Schepmoes A. A.; Zhang X.; Moore R. J.; Monroe M. E.; Lee J. H.; Camp D. G.; Smith R. D.; Qian W. J. J. Proteome Res. 2010, 9, 5698–5704. [DOI] [PMC free article] [PubMed] [Google Scholar]
- Xie F.; Liu T.; Qian W.-J.; Petyuk V. A.; Smith R. D. J. Biol. Chem. 2011, 286, 25443–25449. [DOI] [PMC free article] [PubMed] [Google Scholar]
- Washburn M. P.; Wolters D.; Yates J. R. Nat. Biotechnol. 2001, 19, 242–247. [DOI] [PubMed] [Google Scholar]
- Gedela S.; Medicherla N. Chromatographia 2007, 65, 511–518. [Google Scholar]
- Shen Y.; Zhao R.; Berger S. J.; Anderson G. A.; Rodriguez N.; Smith R. D. Anal. Chem. 2002, 74, 4235–4249. [DOI] [PubMed] [Google Scholar]
- Shen Y.; Zhang R.; Moore R. J.; Kim J.; Metz T. O.; Hixson K. K.; Zhao R.; Livesay E. A.; Udseth H. R.; Smith R. D. Anal. Chem. 2005, 77, 3090–3100. [DOI] [PubMed] [Google Scholar]
- Shen Y.; Tolić N.; Masselon C.; Paša-Tolić L.; Camp D. G.; Hixson K. K.; Zhao R.; Anderson G. A.; Smith R. D. Anal. Chem. 2003, 76, 144–154. [DOI] [PubMed] [Google Scholar]
- Thakur S. S.; Geiger T.; Chatterjee B.; Bandilla P.; Fröhlich F.; Cox J.; Mann M.. Mol. Cell. Proteomics 2011, 10, M110.003699 (DOI: 10.1074/mcp.M110.003699). [DOI] [PMC free article] [PubMed] [Google Scholar]
- Shi T.; Fillmore T. L.; Sun X.; Zhao R.; Schepmoes A. A.; Hossain M.; Xie F.; Wu S.; Kim J. S.; Jones N.; Moore R. J.; Pasa-Tolic L.; Kagan J.; Rodland K. D.; Liu T.; Tang K.; Camp D. G. 2nd; Smith R. D.; Qian W. J. Proc. Natl. Acad. Sci. U.S.A. 2012, 109, 15395–15400. [DOI] [PMC free article] [PubMed] [Google Scholar]
- Tan H. T.; Tan S.; Lin Q.; Lim T. K.; Hew C. L.; Chung M. C. M. Mol. Cell. Proteomics 2008, 7, 1174–1185. [DOI] [PubMed] [Google Scholar]
- Murphy J. P.; Pinto D. M. Proteomics 2010, 10, 1847–1860. [DOI] [PubMed] [Google Scholar]
- Tu C.; Li J.; Jiang X.; Sheflin L. G.; Pfeffer B. A.; Behringer M.; Fliesler S. J.; Qu J. Mol. Cell. Proteomics 2013, 12, 3583–3598. [DOI] [PMC free article] [PubMed] [Google Scholar]
- Tu C.; Mammen M. J.; Li J.; Shen X.; Jiang X.; Hu Q.; Wang J.; Sethi S.; Qu J. J. Proteome Res. 2014, 13, 627–639. [DOI] [PMC free article] [PubMed] [Google Scholar]
- Schacke H.; Docke W. D.; Asadullah K. Pharmacol. Ther. 2002, 96, 23–43. [DOI] [PubMed] [Google Scholar]
- Hazra A.; Pyszczynski N.; DuBois D. C.; Almon R. R.; Jusko W. J. Biopharm. Drug Dispos. 2007, 28, 263–273. [DOI] [PMC free article] [PubMed] [Google Scholar]
- Almon R.; DuBois D.; Brandenburg E.; Shi W.; Zhang S.; Straubinger R.; Jusko W. J. Pharmacokinet. Pharmacodyn. 2002, 29, 103–129. [DOI] [PubMed] [Google Scholar]
- Jusko W.; Jin J.; Bois D.; Almon R. In Advanced Methods of Pharmacokinetic and Pharmacodynamic Systems Analysis; D’Argenio D., Ed.; Springer: New York, 2004; pp 85–103. [Google Scholar]
- Duan X.; Young R.; Straubinger R. M.; Page B.; Cao J.; Wang H.; Yu H.; Canty J. M.; Qu J. J. Proteome Res. 2009, 8, 2838–2850. [DOI] [PMC free article] [PubMed] [Google Scholar]
- Kocher T.; Pichler P.; Swart R.; Mechtler K. Nat. Protoc. 2012, 7, 882–890. [DOI] [PubMed] [Google Scholar]
- Makarov A.; Denisov E.; Kholomeev A.; Balschun W.; Lange O.; Strupat K.; Horning S. Anal. Chem. 2006, 78, 2113–2120. [DOI] [PubMed] [Google Scholar]
- Cao J.; Covarrubias V. M.; Straubinger R. M.; Wang H.; Duan X.; Yu H.; Qu J.; Blanco J. G. Anal. Chem. 2010, 82, 2680–2689. [DOI] [PMC free article] [PubMed] [Google Scholar]
- Qu J.; Lesse A.; Brauer A.; Cao J.; Gill S.; Murphy T. BMC Microbiol. 2010, 10, 162. [DOI] [PMC free article] [PubMed] [Google Scholar]
- Tu C.; Li J.; Sheng Q.; Zhang M.; Qu J. J. Proteome Res. 2014, 13, 2069–2079. [DOI] [PMC free article] [PubMed] [Google Scholar]
- Hager L. J.; Palmiter R. D. Nature 1981, 291, 340–342. [DOI] [PubMed] [Google Scholar]
- Necela B. M.; Cidlowski J. A. Proc. Am. Thorac. Soc. 2004, 1, 239–246. [DOI] [PubMed] [Google Scholar]
- Ramakrishnan R.; DuBois D. C.; Almon R. R.; Pyszczynski N. A.; Jusko W. J. J. Pharmacokinet. Pharmacodyn. 2002, 29, 1–24. [DOI] [PMC free article] [PubMed] [Google Scholar]
- Boudinot F. D.; D’Ambrosio R.; Jusko W. J. Pharmacokinet. Biopharm. 1986, 14, 469–493. [DOI] [PubMed] [Google Scholar]
- Baki L.; Alexis M. N. Biochem. J. 1996, 320, 745–753. [DOI] [PMC free article] [PubMed] [Google Scholar]
- Hanson R. W.; Reshef L. Annu. Rev. Biochem. 1997, 66, 581–611. [DOI] [PubMed] [Google Scholar]
- Pave-Preux M.; Ferry N.; Bouguet J.; Hanoune J.; Barouki R. J. Biol. Chem. 1988, 263, 17459–17466. [PubMed] [Google Scholar]
- Friedman J. E. Am. J. Physiol. Endocrinol. Metab. 1994, 266, E560–E566. [DOI] [PubMed] [Google Scholar]
- Möllmann H.; Hochhaus G.; Rohatagi S.; Barth J.; Derendorf H. Pharm. Res. 1995, 12, 1096–1100. [DOI] [PubMed] [Google Scholar]
Associated Data
This section collects any data citations, data availability statements, or supplementary materials included in this article.


