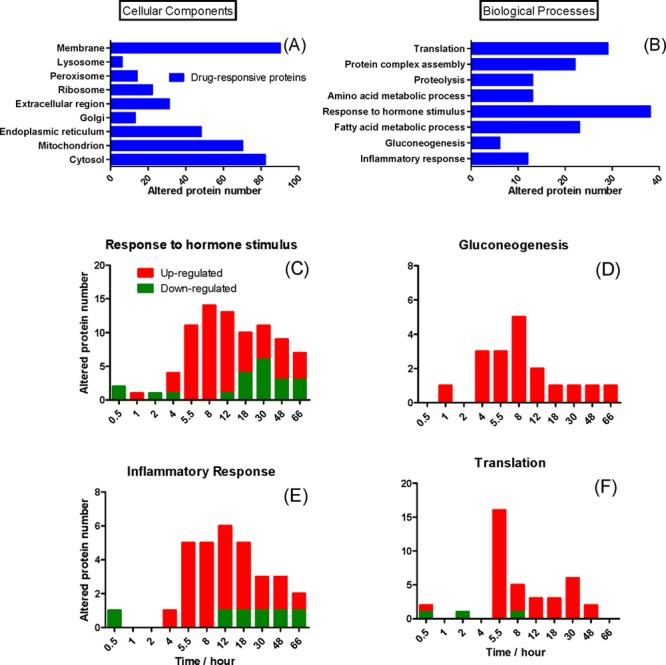
Figure 5.

Gene ontology annotation of significantly altered proteins. The distributions of the altered proteins by (A) cellular components and (B) biological processes. Representative time courses of the number of changed proteins are shown in panels (C)–(F). The up- and down- regulated proteins are denoted in red and green, respectively.
