
Figure 6.
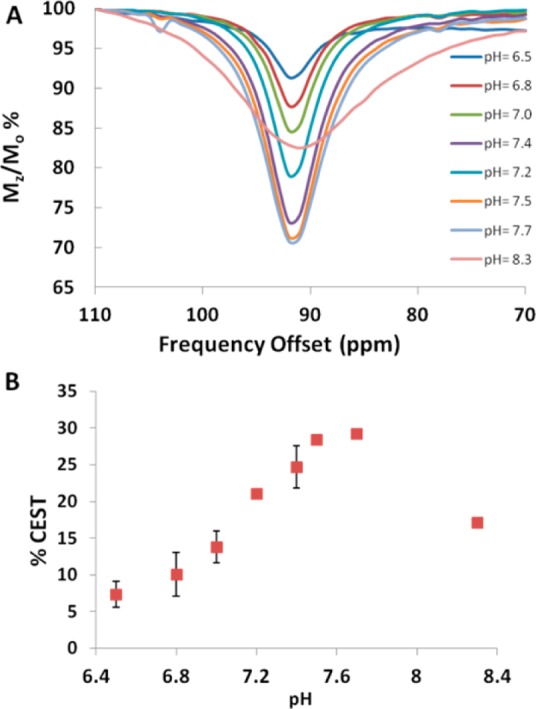
The pH dependence of the magnitude of the CEST peak at 11.7 T of solutions containing (A) 10 mM [Fe(L)]2+, 20 mM buffer pH 6.5–8.3, and 100 mM NaCl. (B) Plot of the CEST effect for 10 mM [Fe(L)]2+, 20 mM buffer pH 6.5–8.3, and 100 mM NaCl. The radio frequency presaturation pulse was applied for 2 s, B1 = 24 μT at 37 °C. Error bars represent standard deviations and are measured for all points.