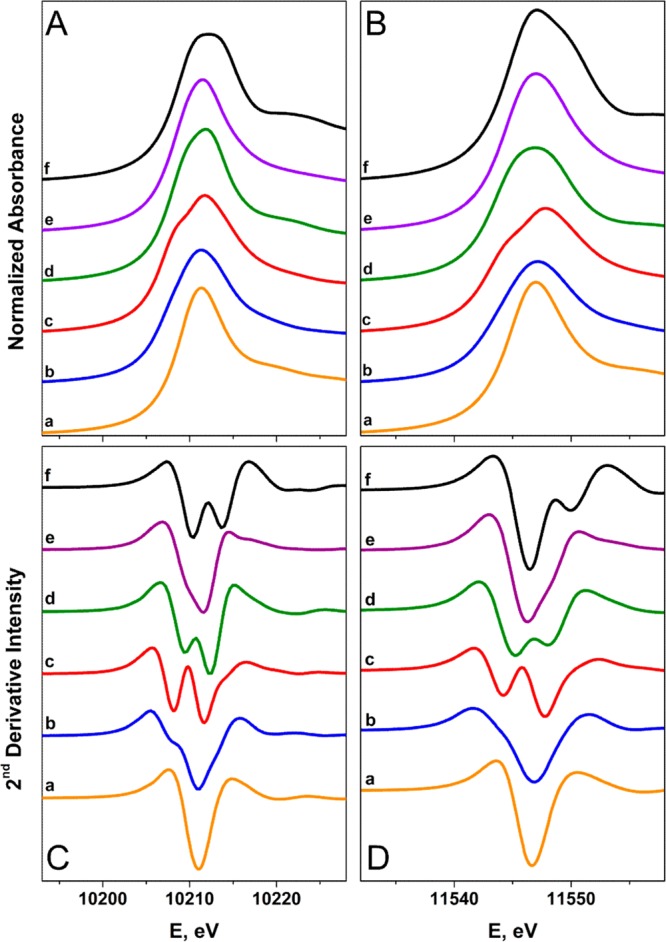
Figure 4.

Comparison of the normalized W L3- (panel A) and L2-edge (panel B) and their FFT-smoothed second derivative spectra (panels C and D) of (a) [W0(PMe3)6], (b) [WIICl2(PMePh2)4], (c) [WIIICl2(dppe)2][PF6], (d) [WIVCl4(PMePh2)2], (e) [WV(NPh)Cl3(PMe3)2], and (f) [WVICl6].
