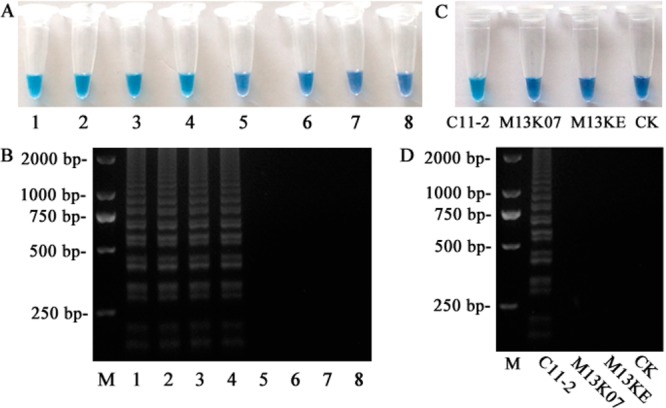
Figure 4.

Sensitivity and specificity of the LAMP reaction. The sensitivity was evaluated on (A) HNB visualization of color change and (B) 2% agarose gel electrophoresis analysis of the LAMP products. Specificity was assessed by detecting 2 × 10⁶ pfu mL–1 helper phage M13K07 and 1 mg μL–1 M13KE vector, the result was observed by (C) color change and (D) 2% agarose gel electrophoresis. M represented 2000 bp DNA mark; 1 represented positive control; 8 and CK represented negative control; 2 to 7 respectively represented 8.5 × 10⁴, 1.7 × 10⁴, 8.5 × 10³, 1.7 × 10³, 8.5 × 10², and 1.7 × 10² pfu mL–1 C11-2.
