
FIGURE 2.
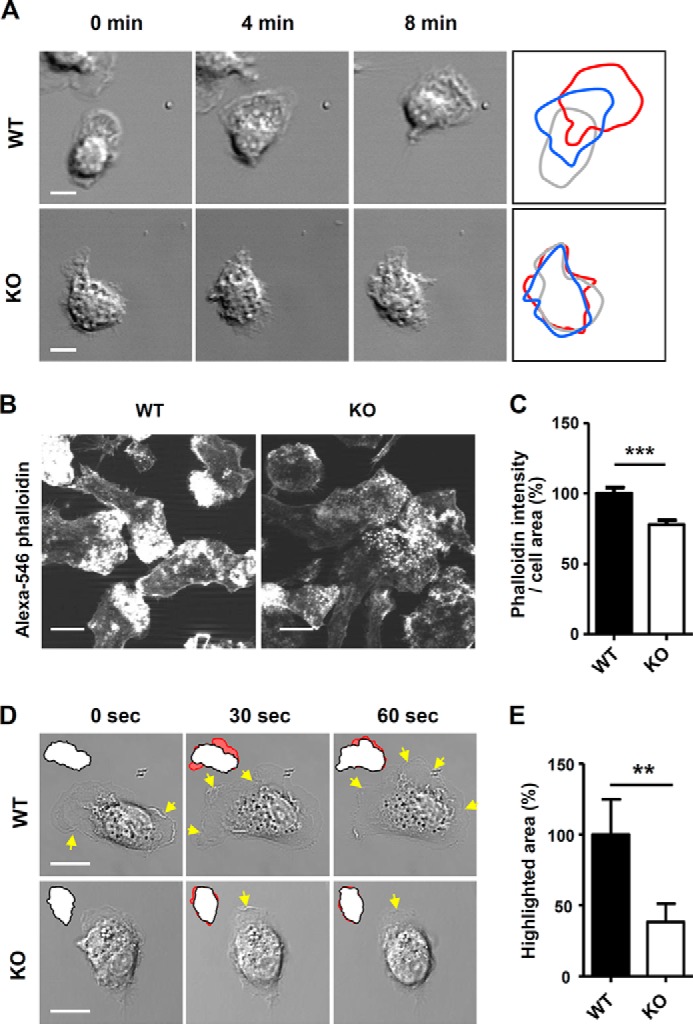
Ninjurin1-deficient BMDMs have reduced membrane protrusions and less active dynamics. A, differential plots of WT or Ninjurin1 knock-out (KO) BMDM cell boundaries from successive video frames. Scale bar, 10 μm. B and C, Alexa 546 phalloidin staining of WT and KO BMDMs. Images were acquired using the same exposure times (B). The phalloidin intensity and area of each cell were measured using ImageJ software, and the values are expressed as the unit of intensity per area (C). Representative results are shown from three experiments. Scale bar, 10 μm. ***, p < 0.001. D and E, membrane dynamics of WT and Ninjurin1-deficient BMDMs. D, yellow arrows indicate the regions of membrane ruffling, and red highlighted regions indicate the differential cell area at each time point from successive video frames. E, highlighted area from ∼20 cells per group was measured and normalized to that of WT cells. Scale bar, 10 μm. **, p < 0.01.