FIGURE 3.

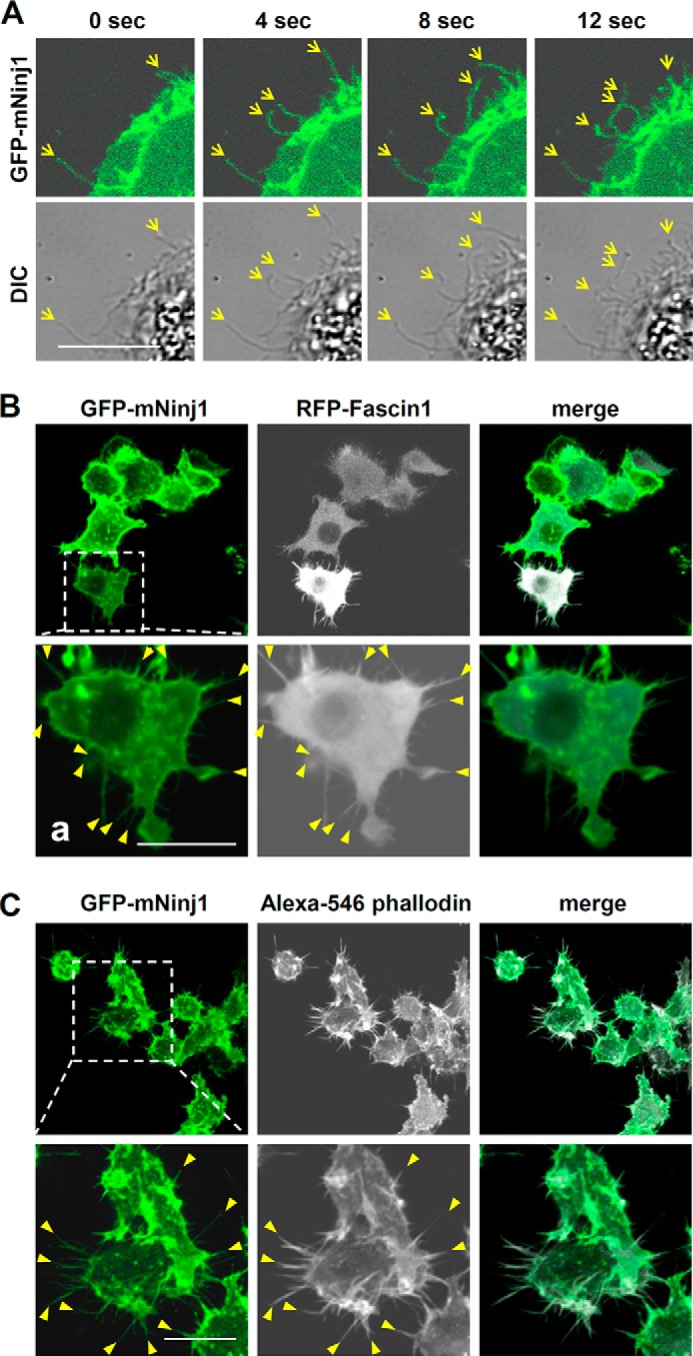
Localization of GFP-mNinj1 in filopodial structures. A, distribution of GFP-mNinj1 in BMDMs. Differential interference contrast (DIC) and GFP-mNinj1 signals (green) were acquired at each time point by using confocal microscopy. Yellow arrows indicate filopodium-like structures. Scale bar, 10 μm. B and C, co-localization of GFP-mNinj1 with filopodial markers RFP-Fascin1 (B) and Alexa 546 phalloidin (C) in Raw264.7 cells. Square boxes show high magnification images of each labeled Raw264.7 cell, and yellow arrowheads indicate filopodial structures expressing RFP-Fascin1 (B) or Alexa 546-phalloidin (C). Scale bar, 10 μm.
