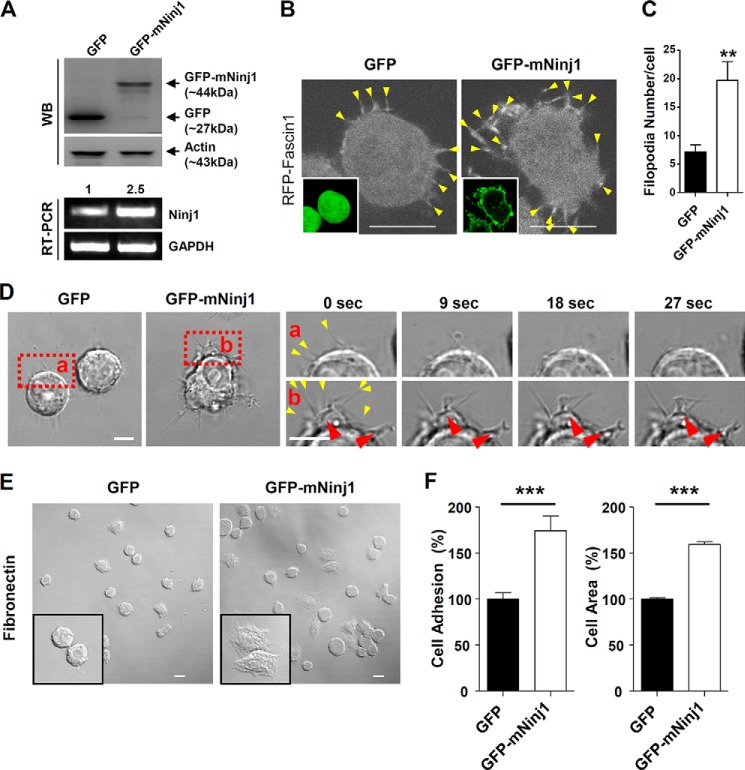
FIGURE 5.
Overexpression of Ninjurin1 in Raw264.7 cells increases the number of filopodial membrane protrusions and their dynamics. A, Western blot (top panel) and RT-PCR (bottom panel) analyses of GFP and GFP-mNinj1 Raw264.7 cells. Number of RT-PCR analyses indicate relative expression of Ninjurin1 in each cell. B and C, transfection of RFP-Fascin1 into stable GFP or GFP-mNinj1 Raw264.7 cell lines. B, arrowheads indicate filopodial structures expressing RFP-Fascin1. Images in square boxes show the GFP signal of each cell. C, statistical analysis was performed using data from ∼30 cells. Scale bar, 10 μm. **, p < 0.01. D, membrane dynamics of GFP or GFP-mNinj1 Raw264.7 cells. The red squares (panels a and b) show high magnification images of GFP and GFP-mNinj1 Raw264.7 cells, respectively. The red arrowheads indicate a pseudopodia-like foot, and the yellow arrowheads show filopodial protrusions. Scale bar, 10 μm. E and F, adhesion and spreading of GFP and GFP-mNinj1 Raw264.7 cells on plates coated with fibronectin (50 μg/ml), 15 min after cell seeding. Square boxes show high magnification images of the attached cells. Scale bar, 50 μm. ***, p < 0.001.

