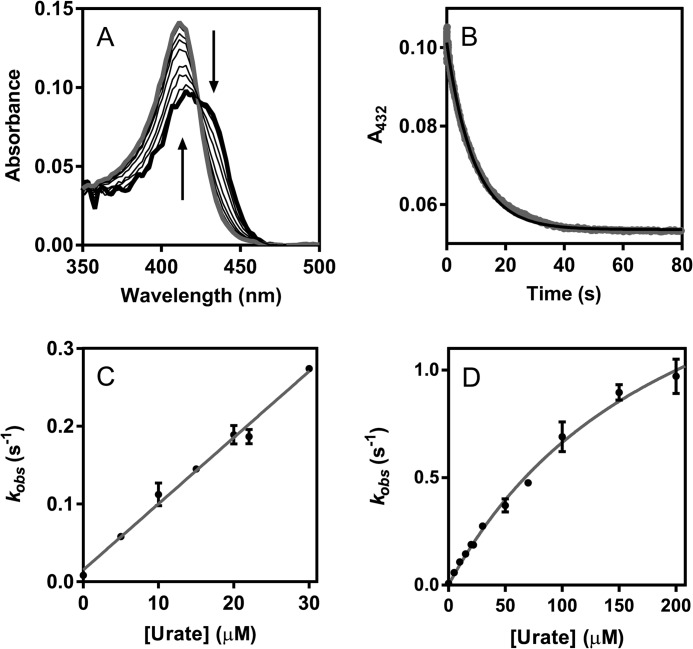
FIGURE 4.
Determination of the rate constant for the reaction of LPO compound II with urate. LPO (1 μm) was premixed with hydrogen peroxide (1 μm) to form compound I at 25 °C in 50 mm phosphate buffer, pH 7.0. After a delay time of 100 ms or 2 s, urate was added (0–200 μm). A, spectral changes after the addition of urate (10 μm) followed between 1 ms (thick black line) and 80 s (gray line); only representative spectra are shown (2-s delay time). B, reduction of compound II in A was monitored at 432 nm (gray dots), and the data were fitted to a single exponential function (black line). C, the averaged observed rate constants kobs were plotted against the concentration of urate (black dots). Data are means and ranges of at least duplicate measurements. The slope of the linear fit corresponds to the second-order rate constant of the reaction of LPO compound II with urate. D, the plot of averaged observed rate constants versus urate concentration levels off at high urate concentration. Data are means and ranges of duplicate experiments (black dots) and were fitted to a rectangular hyperbola (gray line) using Equation 1.

