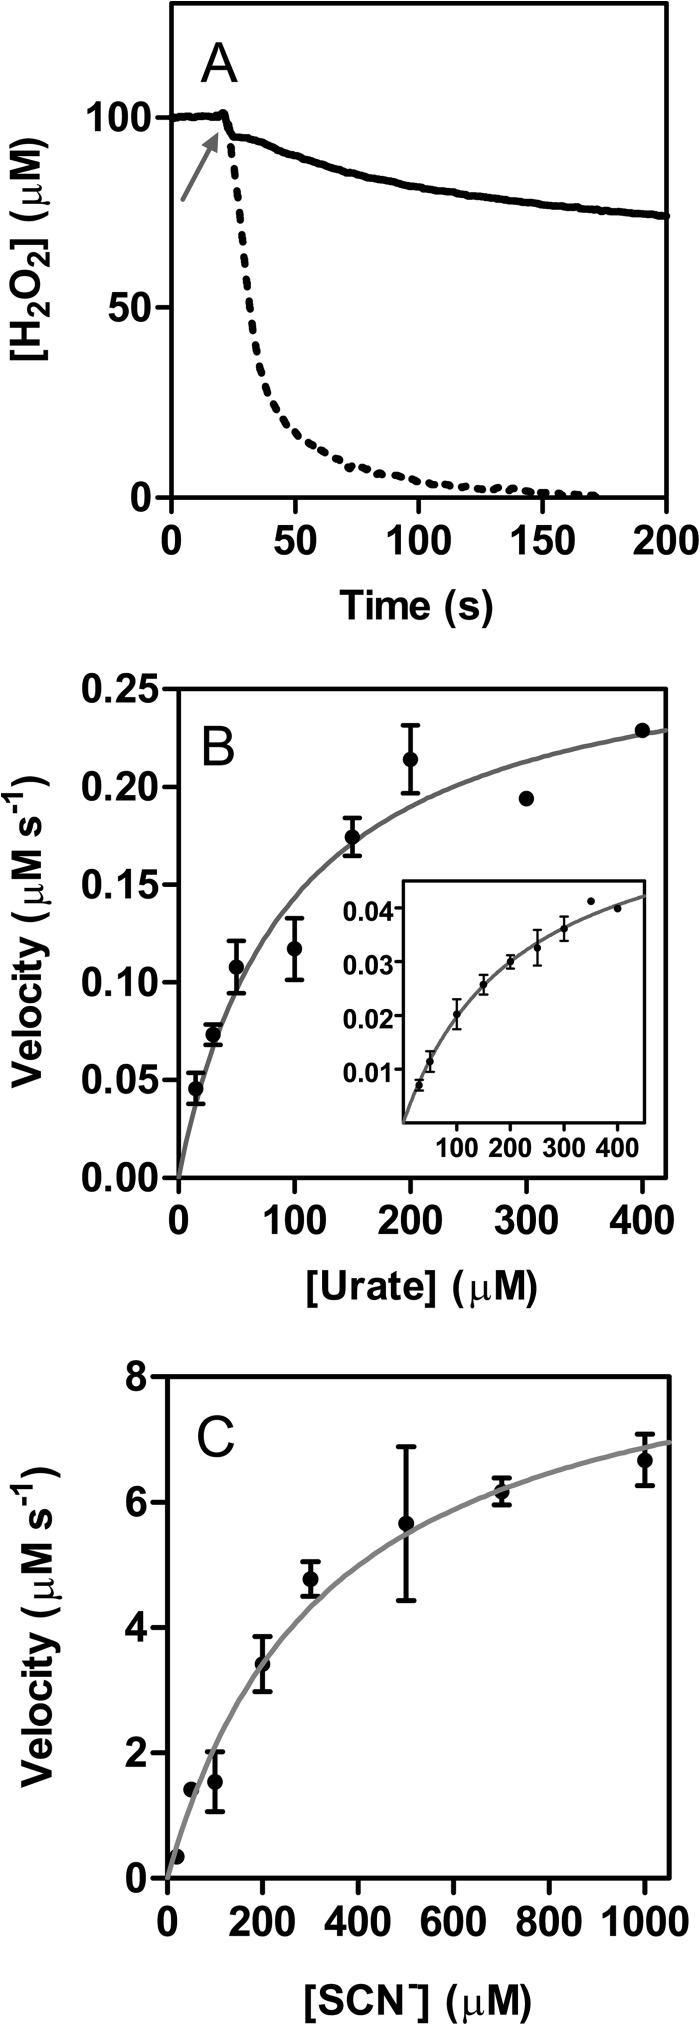
FIGURE 5.
Steady state oxidation of urate and thiocyanate by LPO. A, loss of hydrogen peroxide during thiocyanate (dotted line) and urate (solid line) oxidation by LPO measured continuously using a hydrogen peroxide specific electrode. Reaction mixtures contained 100 μm hydrogen peroxide, 50 nm LPO, and 1 mm thiocyanate or 100 μm hydrogen peroxide, 500 nm LPO, and 300 μm urate, respectively, in 50 mm phosphate buffer, pH 7.0, at 25 °C. Arrow indicates when LPO was added. B, initial phase of urate degradation was monitored at 291 nm except at high urate concentrations (>200 μm), when it was followed by recording hydrogen peroxide depletion. Inset shows data obtained for the secondary phase. Reaction mixtures contained 500 nm LPO, 100 μm hydrogen peroxide, and 30–400 μm urate. The velocities were plotted against substrate concentration (black dots) and were fitted to the Michaelis-Menten equation (gray lines). C, oxidation of thiocyanate by LPO was monitored by measuring the loss of hydrogen peroxide. Reaction mixtures contained 50 nm LPO, 100 μm hydrogen peroxide, and 20–1000 μm thiocyanate. The velocities were verified by following the oxidation of TNB by hypothiocyanite at 412 nm. These experiments were performed under the same reaction conditions with 100 μm TNB added to the reaction mixture. Data are means and standard deviations of at least triplicate experiments.

