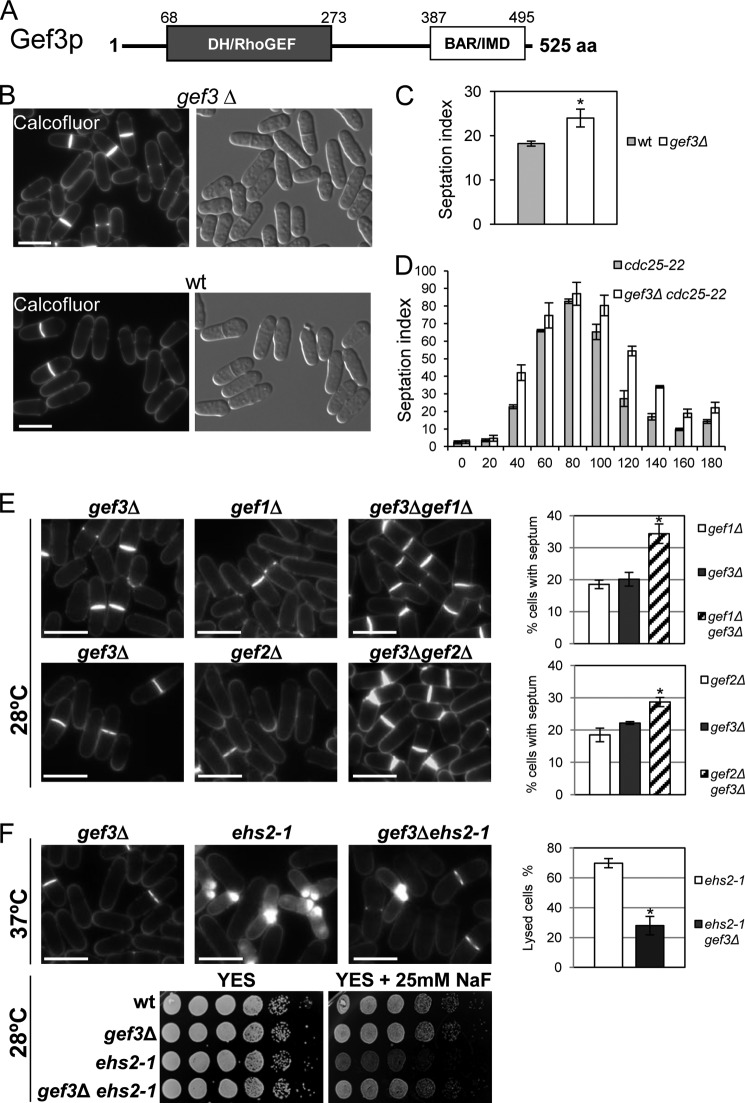
FIGURE 1.
gef3Δ mutant cells show defects in cell separation. A, schematic representation of the domain structure of Gef3p. The numbers indicate amino acids, beginning with the start methionine. DH/RhoGEF, Dbl-homology domain; BAR/IMD, BAR-like homology domain. aa, amino acids. B, morphology of gef3Δ null cells. Cfw staining and differential interference contrast micrographs of S. pombe gef3Δ (SM116) and wild-type (YS64) cells grown in YES liquid medium at 28 °C. Bar, 10 μm. C, asynchronous cultures of wild-type and gef3Δ cells growing exponentially were stained with Cfw. The septation index is the percentage of septated cells in the culture and was quantified directly by fluorescence microscopy (n = 200). Values are the means from three independent experiments, and S.D. bars are indicated. The asterisk indicates that the gef3Δ value is significantly (p < 0.05) different from that of the wild type. D, cultures of cdc25-22 (NG69) and gef3Δ cdc25-22 (SM176) were synchronized in early G2 and released into mitosis. The septation index was quantified as in C at the indicated times (minutes). E, ef3Δ (SM176), gef1Δ (PG153), gef3Δ gef1Δ (SM143), gef2Δ (CL5), and gef3Δ gef2Δ (SM172) cells growing exponentially were stained with Cfw to visualize septa. Bar, 10 μm. The graphs on the right represent the septation index of each set of mutants (the double mutant and the parental strains). At least 200 cells were scored in three independent experiments. Mean values were plotted with error bars representing the S.D. around the mean. *, p < 0.01versus gef3Δ. F, loss of Gef3p reduces the lysis and abolishes the sensitivity to NaF of the ehs2-1 (rgf3) mutant. gef3Δ (SM176), ehs2-1(MS264), and gef3Δehs2-1 (SM152) cells were stained with Cfw. The graphic represents the percentage of lysis of ehs2-1 and gef3Δehs2-1 cell growth for 4 h at 37 °C. The NaF hypersensitivity of wild type, gef3Δ, ehs2-1, and gef3Δehs2-1 was analyzed on a plate assay. Cells were spotted onto YES plates with or without 25 mm NaF as serial dilutions (8 × 10⁴ cells in the left row and then 4 × 10⁴, 2 × 10⁴, 2 × 10³, 2 × 10², and 2 × 101 in each subsequent spot) and incubated at 28 °C for 3 days. *, p < 0.01 versus ehs2-1.

