
FIGURE 3.
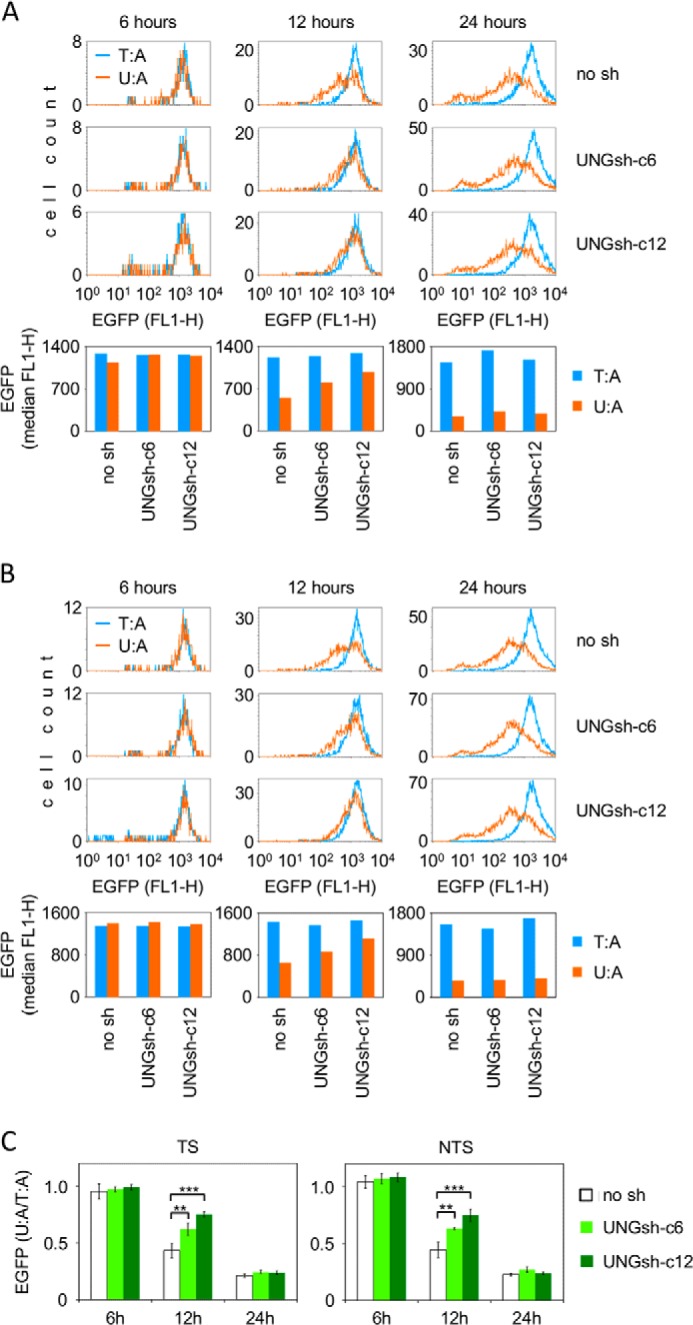
Expression of the EGFP reporter gene containing a unique uracil paired with adenine (U:A) in HeLa-derived cell lines expressing varying levels of the UNG1 and UNG2 proteins (no sh > UNGsh-c6 > UNGsh-c12). A and B, representative flow cytometry experiments for uracil positioned in the TS (A) and NTS (B) and for the respective T:A control constructs. Shown are overlaid distribution plots of EGFP fluorescence in cell populations gated by the expression of the transfection marker Ds-Monomer. The columns show median EGFP fluorescence in cells. No sh, empty vector. C, relative EGFP expression (U:A/T:A) for three (UNGsh-c6) or four independent experiments, in each of which all cell lines were transfected in parallel. Data are mean ± S.D. **, p < 0.01; ***, p < 0.001; paired two-tailed Student's t test.