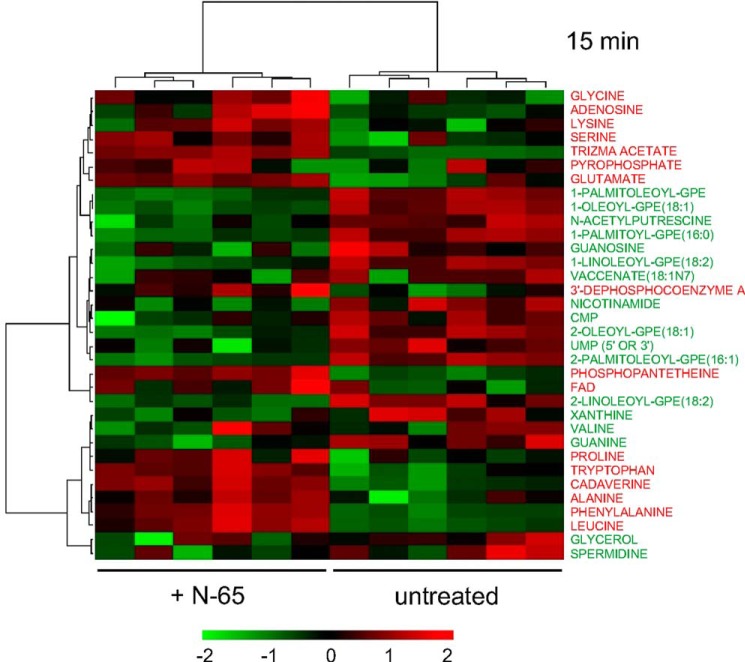
FIGURE 4.
Metabolomic heat map of mid-log phase E. coli revealing N-65-triggered changes at 15 min versus no treatment control. Washed mid-log E. coli were incubated with PB-NaCl (untreated) without or with 6 μm N-65 for 15 min at 37 °C. Cells were washed, flash-frozen, and subjected to metabolite analysis using GC/MS and LC/MS/MS. Raw data values were first log-transformed to be closely distributed as a normal distribution and then assessed by non-parametric Wilcoxon test and two-sample t test. For both tests with p < 0.05, metabolites were considered significantly different and further analyzed by hierarchical clustering for their association patterns.

