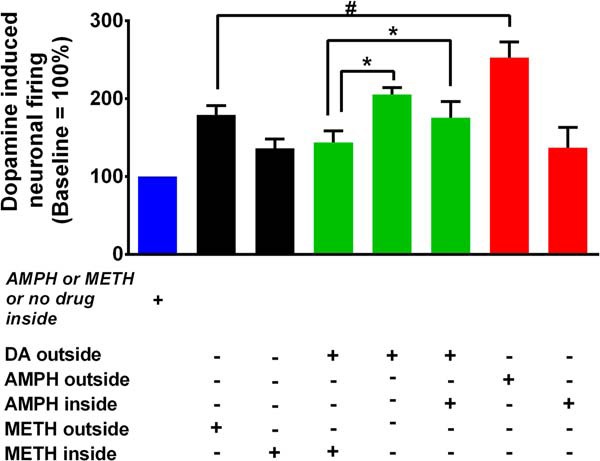
FIGURE 4.

Comparison of the firing activity of dopaminergic neurons across all treatment groups. The bar graph compares dopamine, amphetamine, or methamphetamine regulation of the firing activity of dopaminergic neurons when the drug is applied extra- or intracellularly (#, *; p < 0.05).
