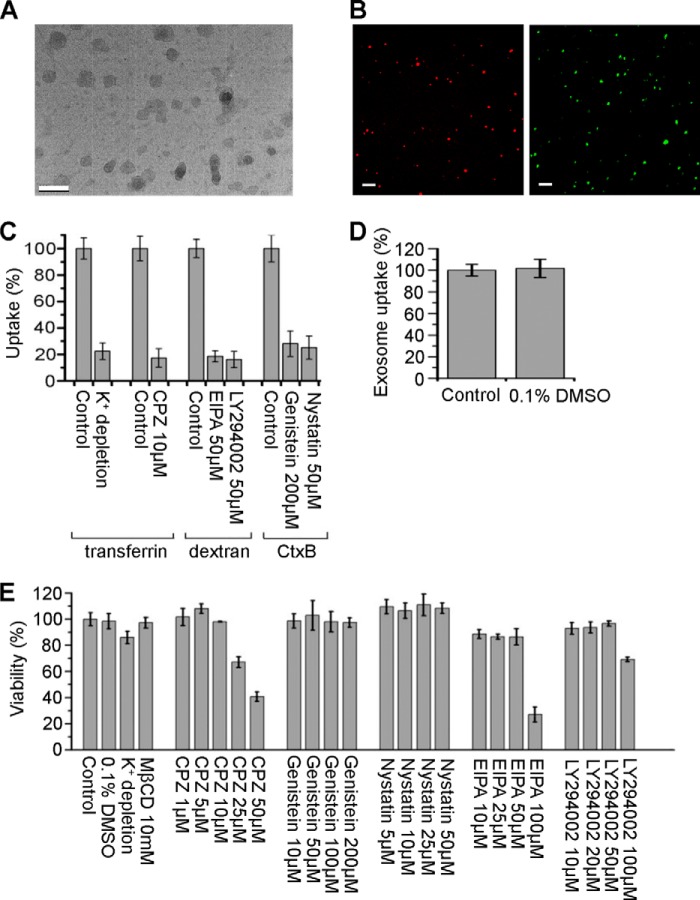
FIGURE 1.
Exosome images and control for pharmacological experiments. A, image of exosomes under electron microscope (scale bar, 200 nm). (B) DiD (red) or CFSE (green)-labeled exosomes detected by fluorescence microscopy (scale bars, 2 μm). C, PC12 cells were pretreated with various inhibitors or not (as control), and then incubated with FITC-transferrin, FITC-dextran, or FITC-CtxB. Uptake was quantified by determining the fluorescence intensity. D, PC12 cells were incubated with exosomes at 37°C for 3 h in the presence or absence (as control) of 0.1% DMSO. Exosome uptake was quantified by determining the fluorescence intensity. E, viability of PC12 cells under the presence or absence (as control) of various treatments at 37°C for 4 h determined by fluorescence intensity of calcein AM. The values are normalized to the control. Mean ± SD of three independent experiments is shown.

