
FIGURE 1.
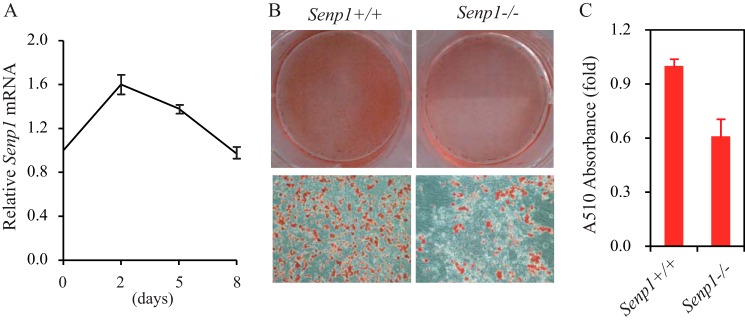
SENP1 deficiency decreases adipocyte differentiation in Senp1−/− MEF cells. A, the expression of SENP1 was analyzed in DMIR-treated MEF cells. Data are mean ± S.D. of three independent experiments. Differences between days 2 or 5 and day 0 were significant (p < 0.01, Student's t test). B, Senp1+/+ and Senp1−/− MEF cells were stained by Oil Red O on day 8 after DMIR treatment. C, the Oil Red O staining in B was quantitatively measured by A510 absorbance analysis. Data are mean ± S.D. of three independent experiments. Differences between Senp1+/+ and Senp1−/−MEF cells were significant (p < 0.01, Student's t test).