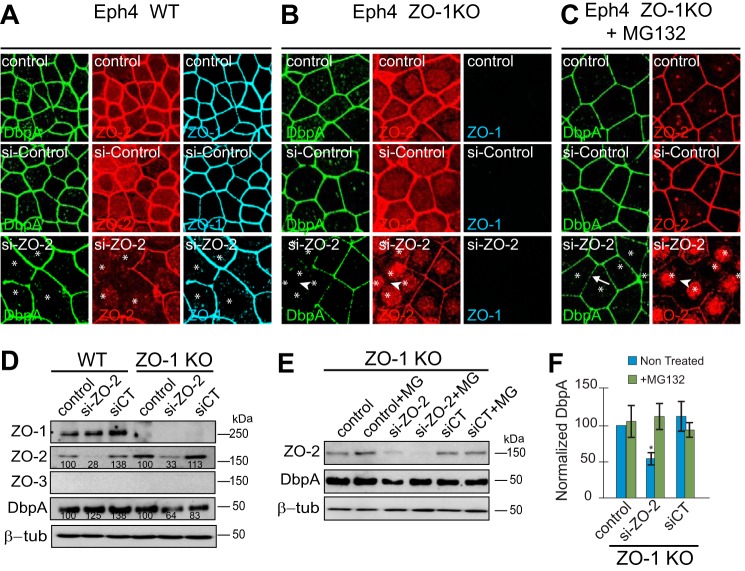
FIGURE 4.
Combined KO/depletion of ZO-1 and ZO-2 in Eph4 cells results in decreased junctional localization and stability of DbpA. A–C, immunofluorescent localization of DbpA (green), ZO-2 (red), and ZO-1 (blue) in confluent Eph4 cells, WT (A), ZO-1KO (B), and ZO-1 KO treated with the proteasome inhibitor MG132 (C). In each panel, the top panels series shows untreated cells, the middle panels show cells treated for 3 days with control siRNA, and the bottom panels show cells treated with ZO-2-specific siRNA. D and E, immunoblotting analysis of ZO-2 and DbpA (ZO-1 and ZO-3 are shown as controls in A) in tubulin-normalized lysates of WT and ZO-1KO Eph4 cells, either untreated (control), or treated with control siRNA (siCT), or ZO-2-specific siRNA (si-ZO-2), in the absence or presence (+MG) of the proteasome inhibitor MG132. F, histogram showing the quantification of DbpA protein levels, as determined by densitometry, taking WT lysates as 100%, in ZO-1KO cells treated as shown in E (E is a representative gel blot of three experiments).

