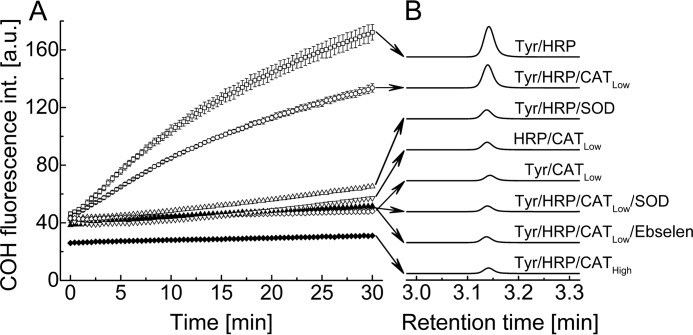
FIGURE 3.
A, time course of CBA oxidation measured in the reaction mixtures containing CBA (0.8 mm), tyrosine (1 mm), HX (1 mm), XO (1 milliunits/ml), and DTPA (0.1 mm) in phosphate buffer (50 mm, pH 7.4) with and without HRP (0.5 units/ml), catalase (0.25 kilounits/ml for CATLow or 25 kilounits/ml for CATHigh), SOD (0.1 mg/ml), and ebselen (0.1 mm). B, comparison of HPLC traces showing COH peaks detected after 30 min of incubation. HPLC traces were collected using a fluorescence detector with an emission wavelength set at 430 nm and an excitation wavelength set at 320 nm.

