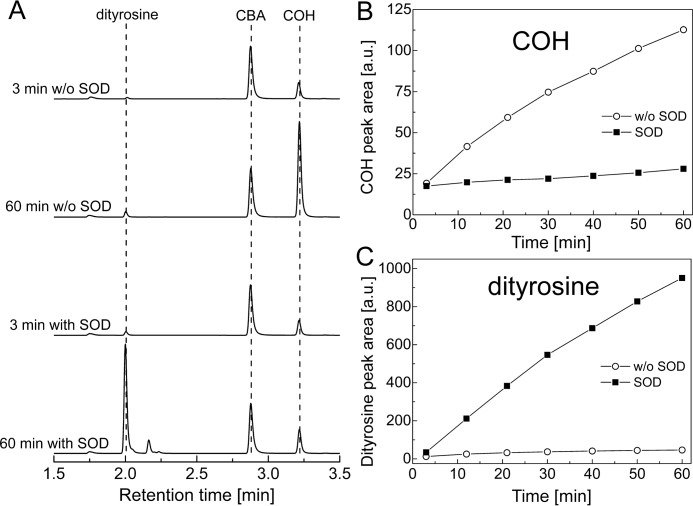
FIGURE 4.
Simultaneous monitoring of dityrosine and COH formation by HPLC with fluorescence detection. Reaction mixtures contained tyrosine (1 mm), hypoxanthine (1 mm), catalase (0.25 kilounits/ml), HRP (0.5 units/ml), XO (0.6 milliunits/ml), SOD (where indicated, 0.1 mg/ml), 0.8 mm CBA, phosphate buffer (50 mm, pH 7.4), and DTPA (0.1 mm) and were incubated for 1 h before analysis. A, collected HPLC traces; B, COH peak areas; C, dityrosine peak areas.

