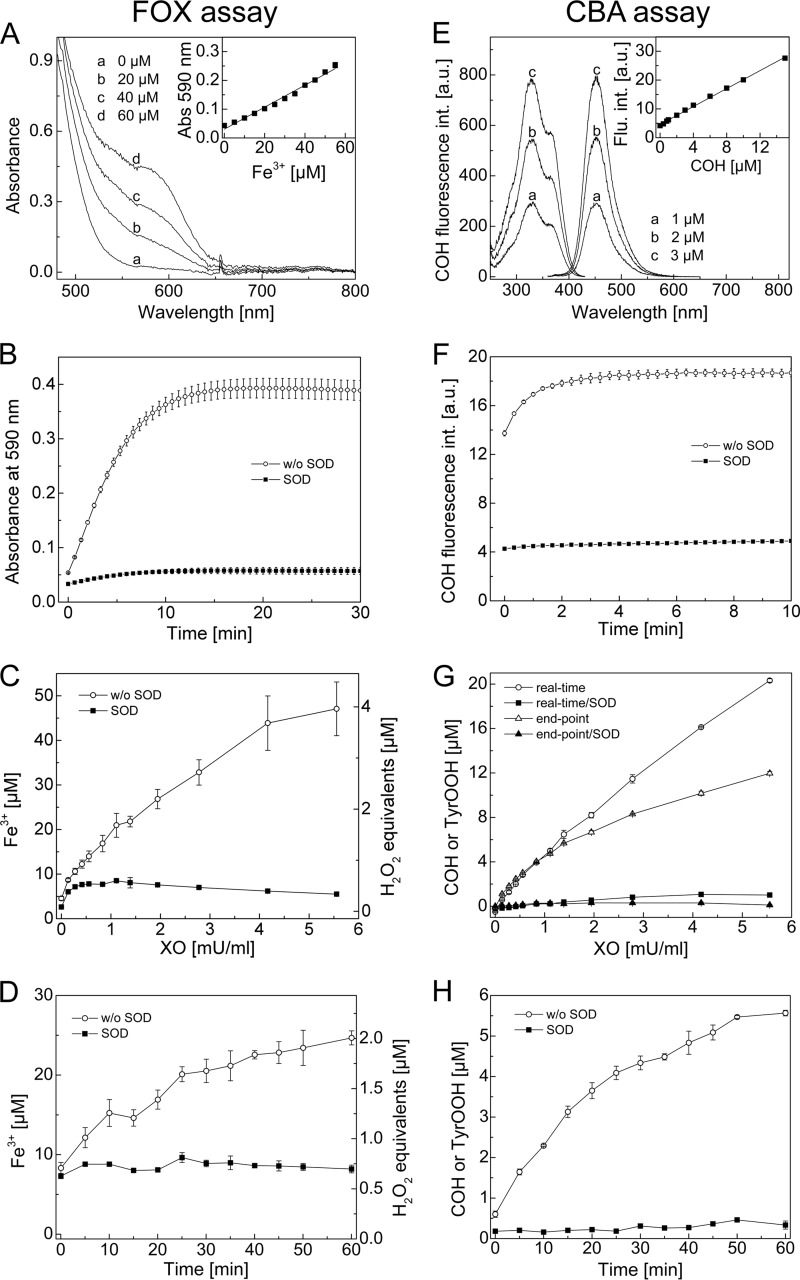
FIGURE 5.
Comparison between FOX and CBA assays. A, absorption spectra recorded during detection of ferric ions by the FOX assay. Inset, calibration curve for ferric ions. B, build-up of absorbance signal at 590 nm upon TyrOOH detection by the FOX assay. C, end point measurement of TyrOOH using the FOX assay. The amount of TyrOOH is given as ferric ion concentration (left axis) and as H2O2 equivalents (right axis). D, accumulation of TyrOOH with time, shown as ferric ion concentration (left axis) and as H2O2 equivalents (right axis), measured by the FOX assay ([XO] = 1.94 milliunits/ml). E, excitation and emission spectra of COH at different concentrations. Inset, calibration curve for COH measured with the plate reader. F, build-up of COH fluorescence signal upon TyrOOH detection using the CBA assay. G, end point measurement and real-time monitoring of TyrOOH by the CBA assay. H, accumulation of TyrOOH with time measured by the CBA assay ([XO] = 1.94 milliunits/ml). Reaction mixtures containing tyrosine (1 mm), hypoxanthine (1 mm), catalase (0.25 kilounits/ml), HRP (0.5 units/ml), XO (0.1–5 milliunits/ml), phosphate buffer (50 mm, pH 7.4), DTPA (0.1 mm, except if FOX reagent was used), and SOD (0.1 mg/ml) were incubated for 1 h (except in D and H). Error bars, S.D.

