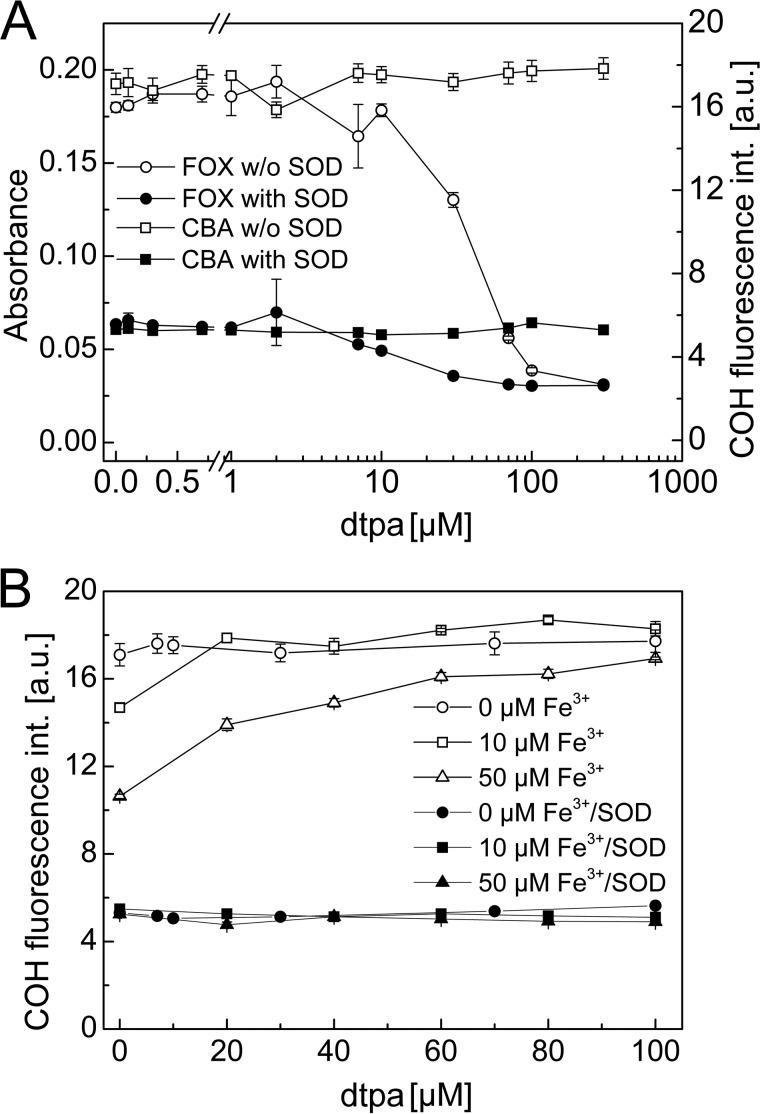
FIGURE 7.
A, influence of iron chelator DTPA on the observed signal for FOX (circles, absorbance scale, left axis) and CBA (squares, fluorescence scale, right axis) assays at constant concentration of TyrOOH. B, effect of DTPA on the yield of TyrOOH generated in the HRP/XO system at different concentrations of ferric ions (0, 10, and 50 μm). Error bars, S.D.

