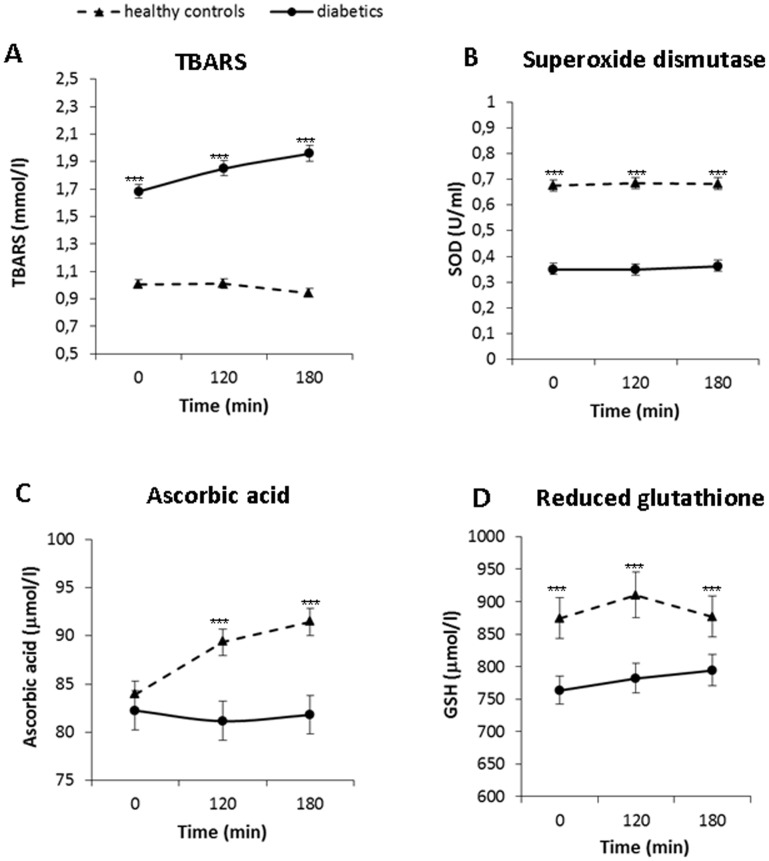
Figure 4. Postprandial changes in plasma concentrations of oxidative stress markers in diabetic (circles, full line) (n = 45) and control subjects (triangles, dashed line) (n = 49) after the standard meal test.
Data are expressed as mean with 95% CI. A: TBARS: Factors time p<0.05, group p<0.001, interaction group×time p<0.01, B: SOD: Factors time p = 0.7, group p<0.001, interaction group×time p = 0.13, C: Ascorbic acid: Factors time p = 0.55, group p<0.001, interaction group×time p<0.01, D: GSH: Factors time p = 0.33, group p<0.001, interaction group×time p = 0.67.

