
Figure 3. IL-17A induces Cl−/HCO3 − exchange at the apical membrane of normal HBE cells.
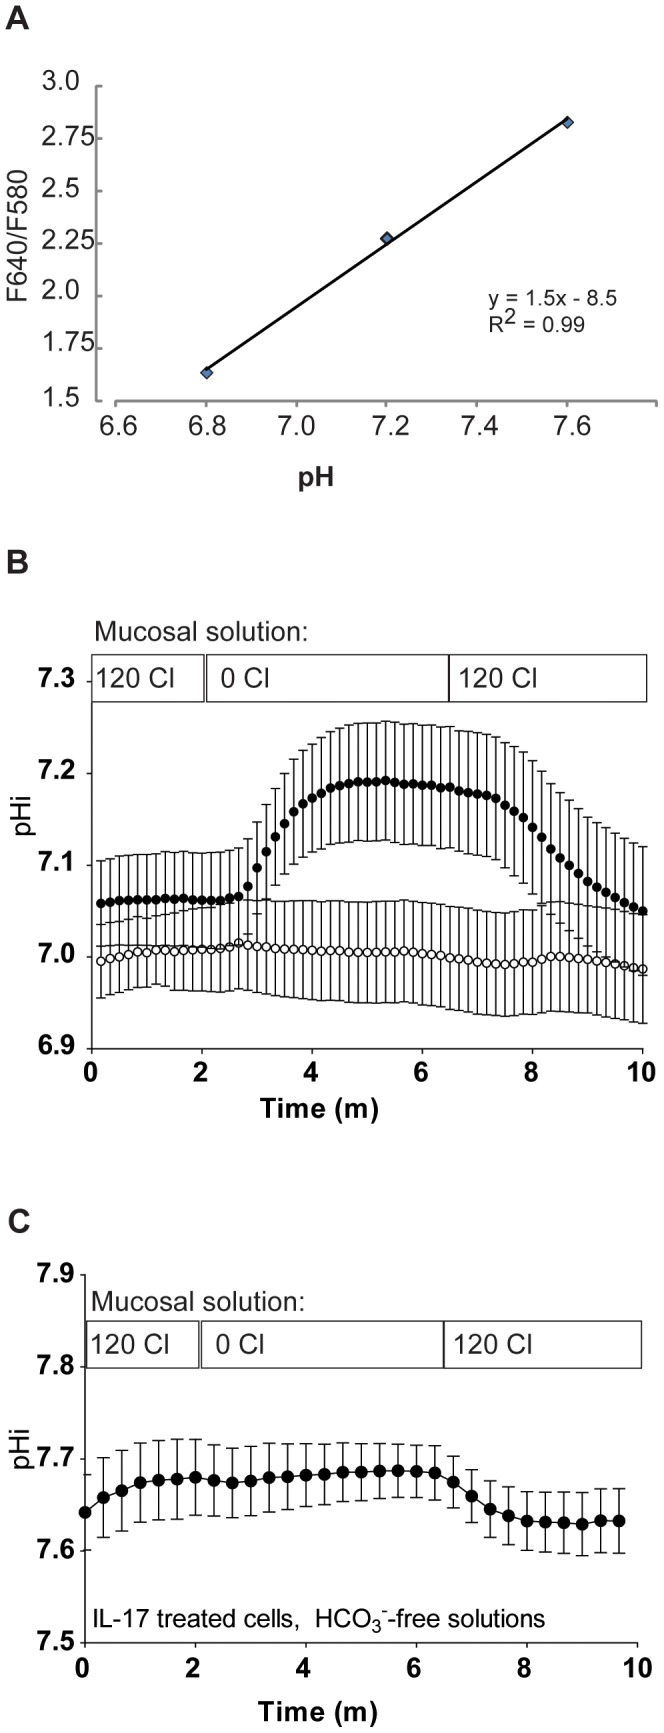
A. Calibration curve of pHi versus F640/580. An insert of HBE cells was loaded with SNARF-5/6-AM and then incubated in high-potassium buffer (pH 6.8, 7.2, or 7.6) containing 20 µM each valinomycin and nigericin for 40 minutes. Five serial measurements over 2 minutes were taken for each filter and the average used to calculate a single calibration point for each pH. Linear fit was performed in Microsoft Excel. B. Intracellular pH changes in response to chloride removal from the apical perfusate (open circles: vehicle, n = 6 inserts; shaded circles: IL-17A (50 ng/ml for 48 h, n = 5 inserts). C. Intracellular pH changes in response to chloride removal from the apical perfusate in the absence of soluble HCO3 − and CO2 (only IL-17A treated cells are shown). Please see the results section in the text for a complete discussion of two-way ANOVA applied to 3b.