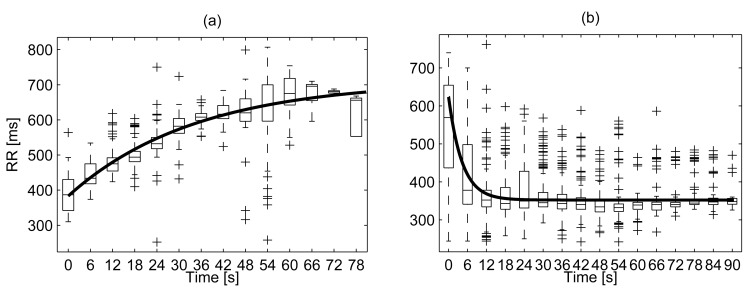
Figure 2. Example of estimation of the fRR time constants during cord occlusion and subsequent recovery.
Panel (a): fRR during mechanical cord occlusion. The data belongs to the fetus of sheep #3 (Table 1). Panel (b): fRR during recovery after UCO for the same case. Box plots summarize the values of fRR at a given time distance from the occlusion (or its release). The model prediction is reported with a bold line. The vertical lines delimit the “whiskers” and the + signs the outliers.

