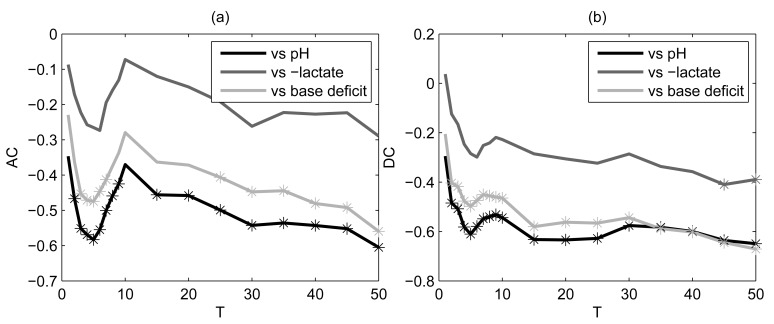
Figure 6. Spearman’s correlation coefficients between AC (a) and DC (b) and each acid-base balance biomarker.
PRSA was performed on stable (concatenated baseline and free of FHR decelerations) baseline fRR intervals. Stars refer to significant p values (p<0.05). Lactate values were multiplied by −1.

