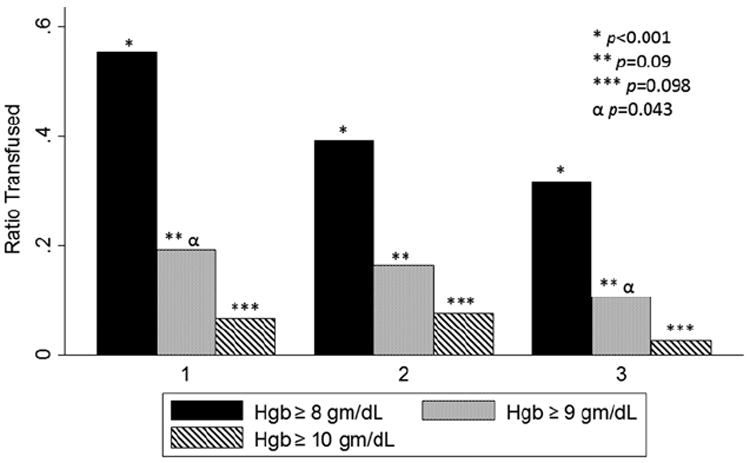
Figure 1.

Bar graph demonstrating the ratio of off-protocol transfusion events by study period for all open heart surgery cases performed during the study, excluding patients massively transfused patients. The x-axis represents the study period. The y-axis represents the ratio of transfused units given at or above a Hgb trigger of 8 (solid bar), 9 (dotted bar) and 10 (striped bar) gm/dL, respectively. The single, double and triple asterisks with associated p values denote Chi-square analyses of each ratio across all study periods. The α symbol denotes Chi-square analysis of transfusions over 9 gm/dL between periods 1 and 3 only.
