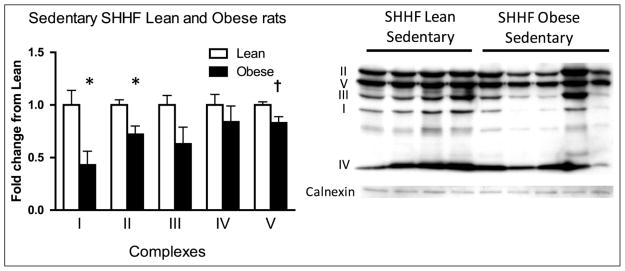
Figure 2.
Differences in aortic mitochondrial OxPhos complexes between SHHF lean and obese rats at baseline. Blots were probed for representative subunits of the mitochondrial complexes of the electron transport chain. Complexes I and II were significantly lower in the SHHF obese rats compared to the SHHF lean rats. SHHF lean rats: n = 8 and SHHF obese rats: n = 10. Data are expressed as mean fold change from SHHF lean + SEM. *p < 0.05, †p = 0.05–0.10, Student’s t-test.
OxPhos: oxidative phosphorylation; SEM: standard error of mean.

