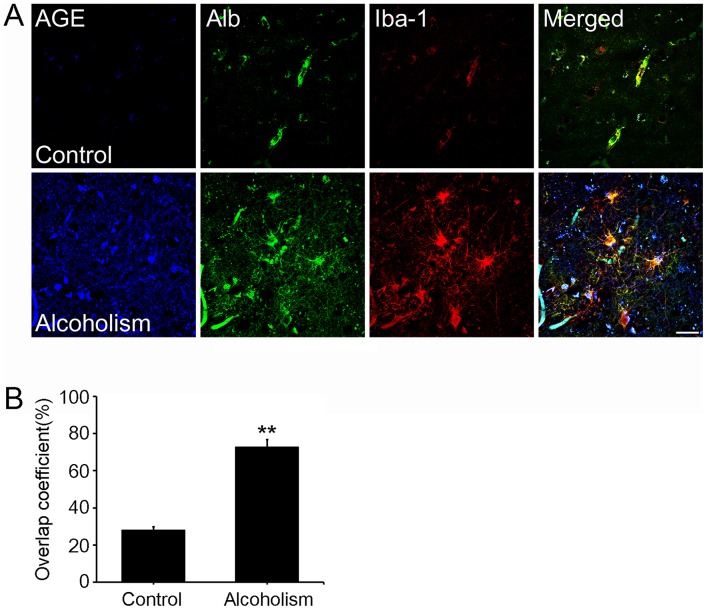
Figure 1. Distribution of AGE-albumin and activated microglial cells in the brains of human alcoholics and control people.
(A) Triple-labeled confocal microscopic image analyses were used to study the distribution and relative levels of AGE (blue), albumin (green), and Iba-1 (red) in the cerebral cortex of human brains from normal people or alcoholic individuals. (B) Densitometry analyses of AGE, albumin, and Iba-1 colocalization were evaluated using Zeiss Zen software. Scale bar = 50 µm. **p<0.001.

