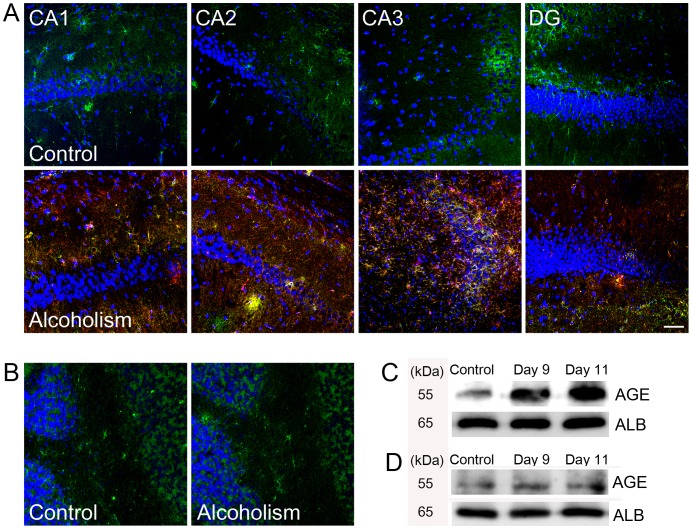
Figure 3. AGE-albumin level in rat brains.
Triple-labeled confocal microscopic image analyses were used to study the distribution and relative levels of albumin (green), AGE (red), and DAPI (blue) in the hippocampus Cornu Ammonis Area1 (CA1), Cornu Ammonis Area2 (CA2), Cornu Ammonis Area3 (CA3), Dendate Gyrus (DG) of the control rats (A) and binge-alcohol exposed rats (B). Scale bar = 50 µm. (C, D) Co-immuonoprecipitation analysis of AGE-ALB in the hippocampus (C) and cerebellum (D) in control or alcohol-exposed rats on days 9 and 11. Scale bar = 50 µm.

