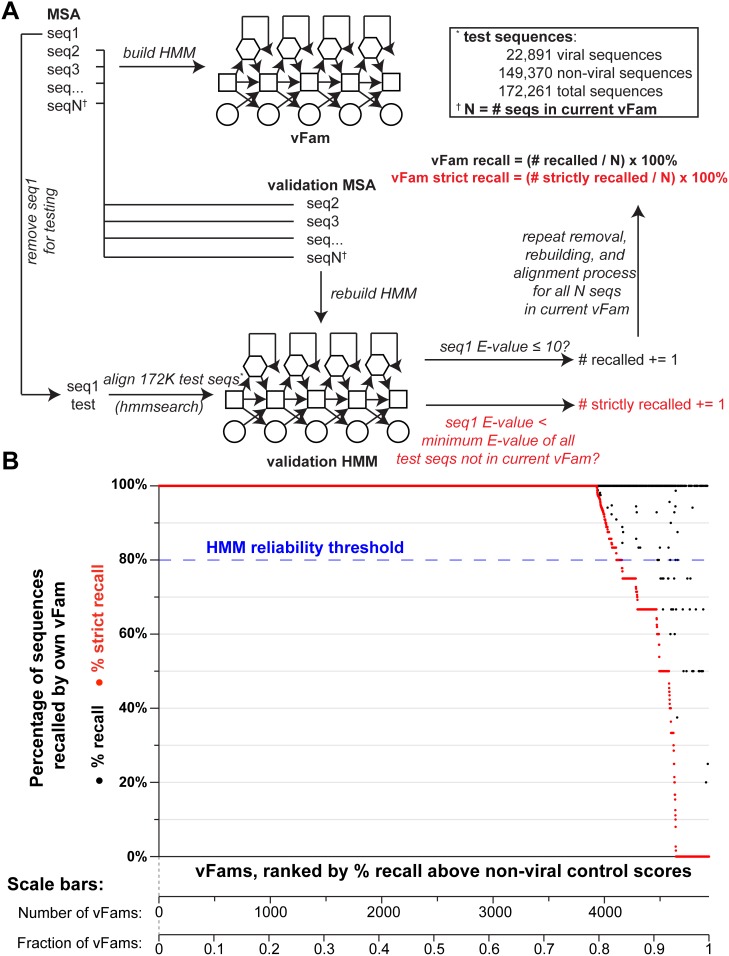
Figure 2. Viral sequence recall for all vFams in cross-validation.
(A) A schematic representation of the cross-validation of the vFams is depicted for a single vFam. The initial multiple sequence alignment (MSA) and HMM building are depicted for the vFam being tested (top left). Each sequence is removed from the vFam exactly once, and a validation MSA and validation HMM are built from the remaining sequences. A set of test sequences comprising a large set of non-viral sequences and all viral sequences across all vFams is aligned to the validation HMM, and the left out sequence is evaluated. If the left out sequence is recalled by the validation HMM with an E-value ≤10, the sequence is considered “recalled” by the vFam (black). If the left out sequence is recalled by the validation HMM and additionally has a lower E-value than all test sequences not in the current vFam, the sequence is considered “strictly recalled” (red). The process is repeated for all “N” sequences in the vFam and the vFam’s % recall and % strict recall are calculated. Each vFam was evaluated in this manner. (B) For each vFam in the cross-validation experiments, the percentage of recalled sequences (black) and the percentage of strictly recalled sequences (i.e., E-value less than non-viral controls; red) is plotted. The vFams are ranked by their percentage of strictly recalled sequences (x-axis). A threshold of 80% strict recall (dashed blue line) was used to filter the vFams to the best performing subset. Scale bars below the x-axis show the number and fraction of vFams in the ranked set.

