
Figure 1. Characterization of small RNAs in F. oxysporum.
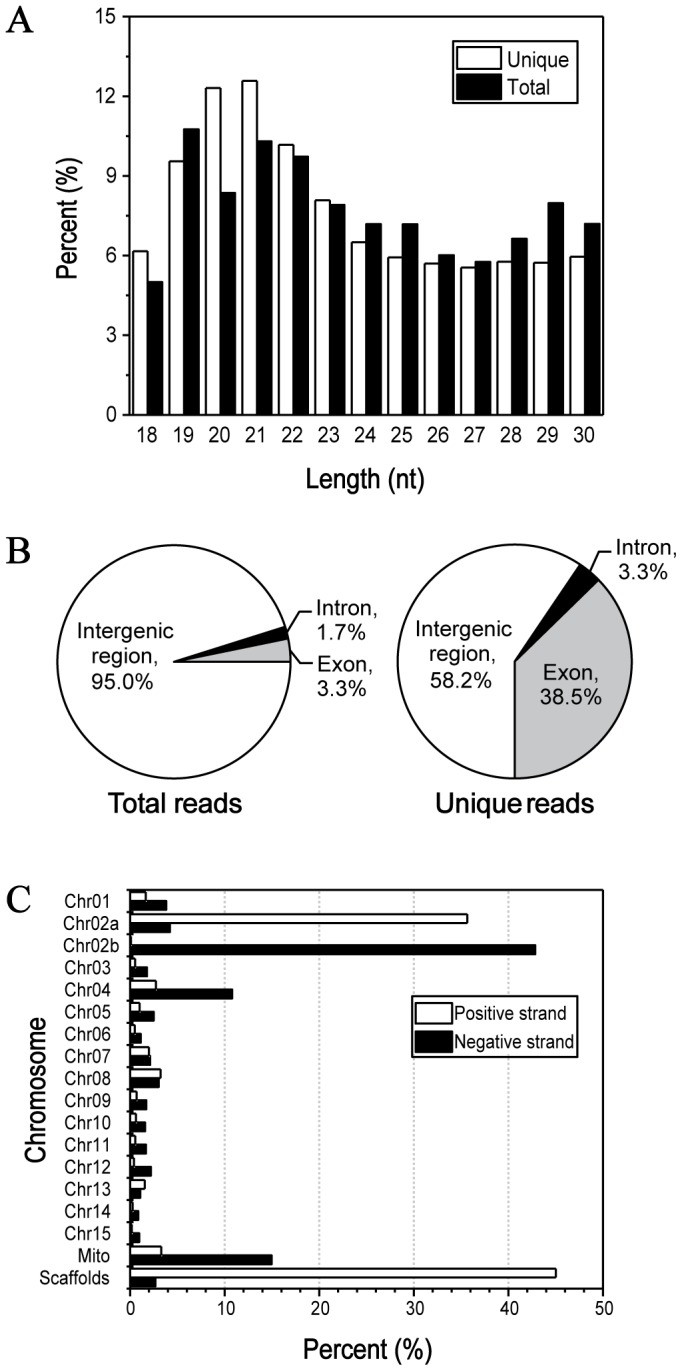
A: Size distribution of small RNAs. White and black columns represent unique and total reads of the small RNAs, respectively. B: Annotation of small RNA loci. Pie graphs show the proportions of small RNAs located in intergenic, exonic and intronic regions, respectively. C: Small RNA distribution on both strands of chromosomes.