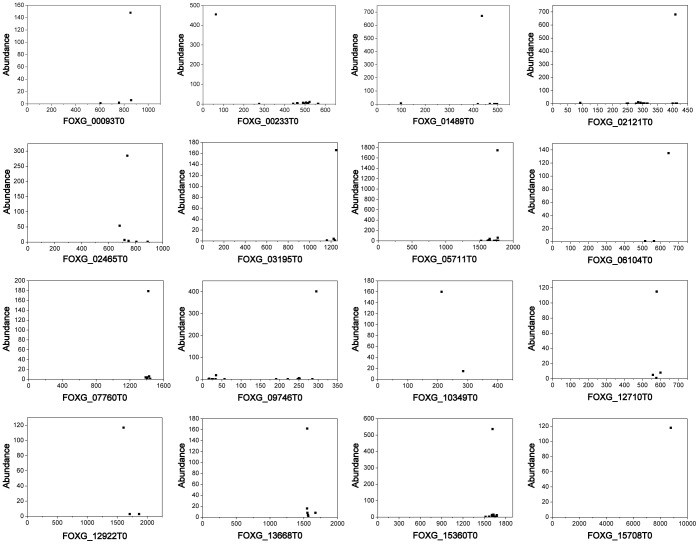
Figure 3. Scatter plot diagrams of degradome data on transcripts.
The 16 most abundant signals with high peak-to-total ratio (>0.8) were selected and illustrated. The x and y axis of each diagram represent position of transcripts and the frequency of tags, respectively. Each tag perfectly matching the transcripts was plotted. However, none of these peak signals correspond to predicted cleavage sites of any small RNAs of F. oxysporum. These truncated transcripts might be particularly stable decay intermediates or products of special endonuclease.

