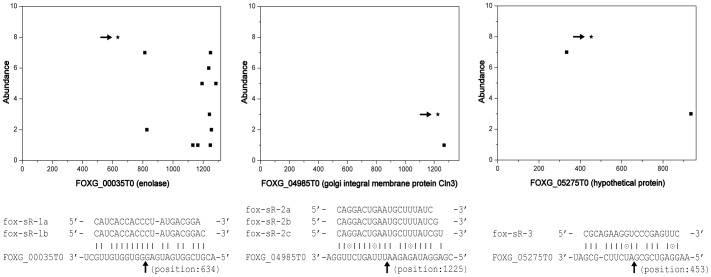
Figure 4. Illustration of three pairs of small RNAs and target transcripts.
Scatter plot diagrams show the frequency of tags and their positions on transcripts. The inferred cleavage sites were indicated by the asterisks and arrows. Although the abundance of tags and small RNAs was relative low, the corresponding small RNAs were experimentally validated by RT-PCR ( Fig. 2C ).

