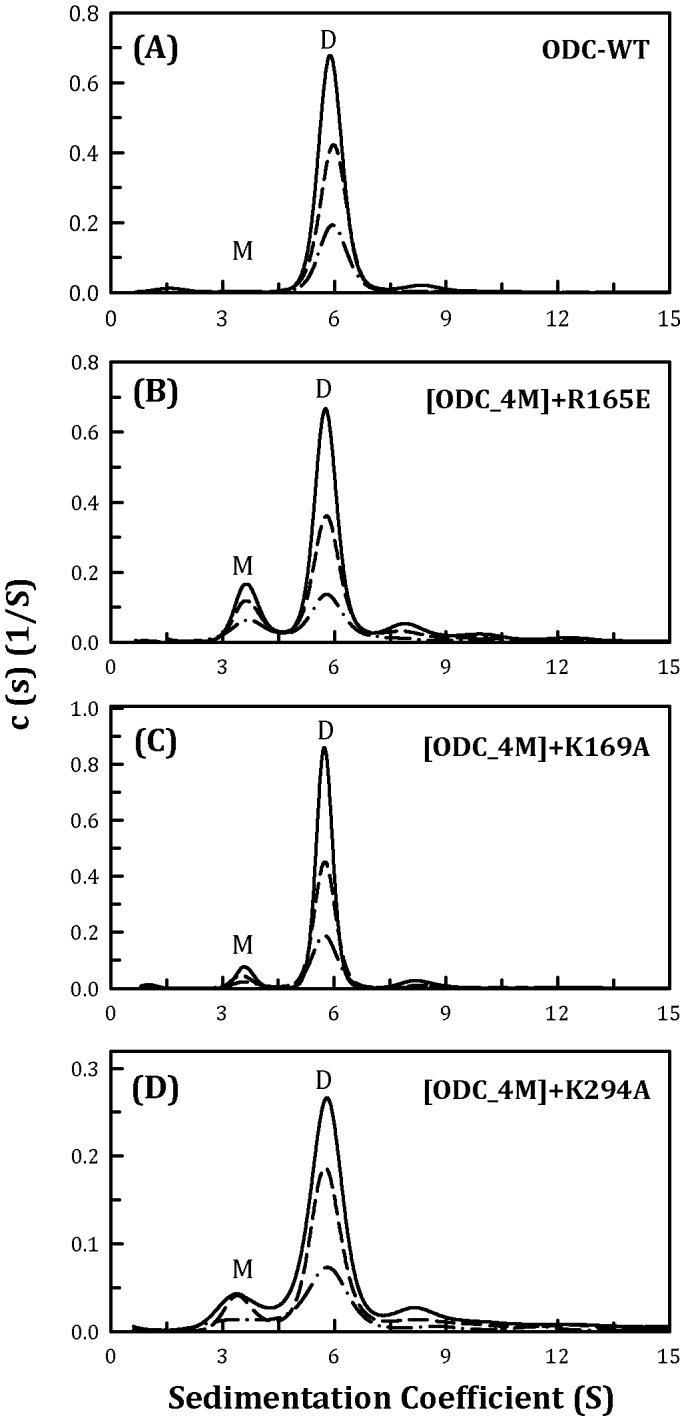
Figure 3. Continuous sedimentation coefficient distribution of the human ODC_WT and the ODC_4M mutants with R165E, K169A and K294A.

The three protein concentrations (from top to bottom) were 0.3, 0.6 and 0.9 mg/ml. (A) ODC_WT; (B) [ODC_4M]+R165E; (C) [ODC_4M]+K169A; and (D) [ODC_4M]+K294A. M, monomer; D, dimer.
