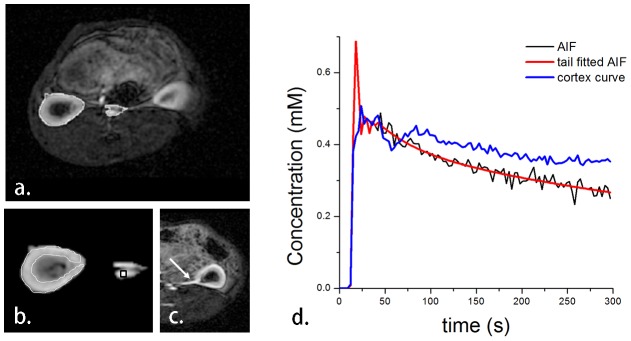
Figure 4. A representative image from DCE-MRI acquisition.

a.) showing the region of interest after segmentation; b.) the manually drawn cortical ROI (white line); c.) the image in which a branch of renal artery is clearly seen is used for aortic ROI drawing; and d.) the concentration curves of each corresponding ROI. The original aortic input function (black line) fits its tail with a biexponential method (shown in red line). The blue line is the cortical concentration curve.
