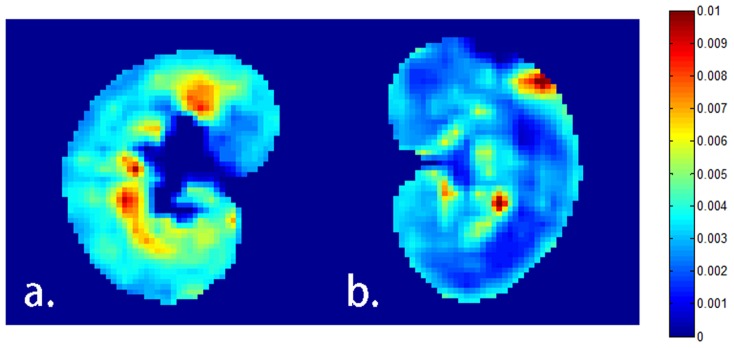
Figure 6. GFR mapping of a.) the normal kidney (right kidney) and b.) the acute ischemia kidney (left kidney) by using the new model.

The left kidney of the rabbit is under surgical ligation for totally 45 minutes, and lower GFR values are clearly observed in the cortex and outer stripes of the outer medulla regions while corresponding regions are high in the control group.
