
Figure 4. The 25 dpa regenerating tail has limited relative expression of stem cell markers.
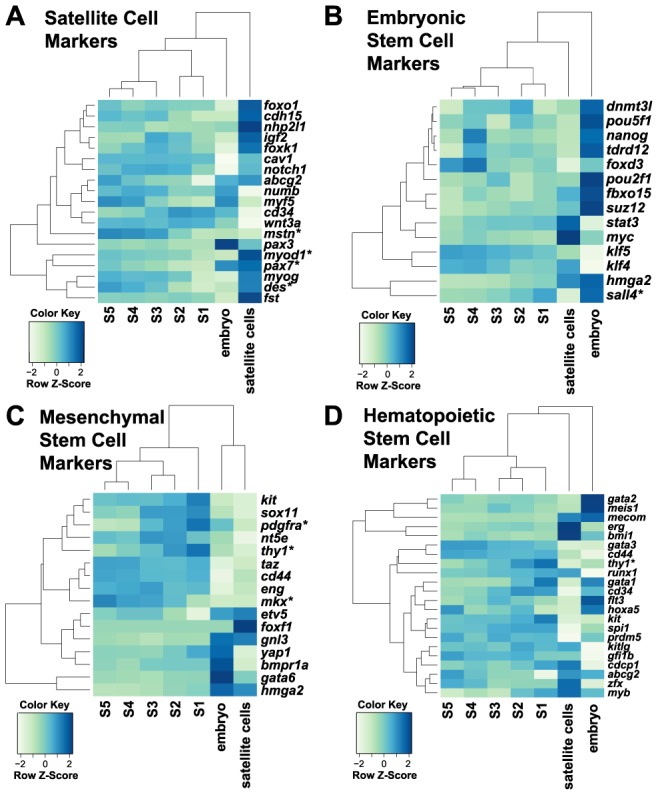
(A-D) Heatmap showing gene expression of satellite cell (A) and embryonic (B), mesenchymal (C), and hematopoietic stem cell markers in lizard embryos (n = 2), satellite cells (n = 3), and 25 dpa regenerating tail sections (n = 5). Differentially expressed genes along the regenerating tail axis are denoted with an asterisk.