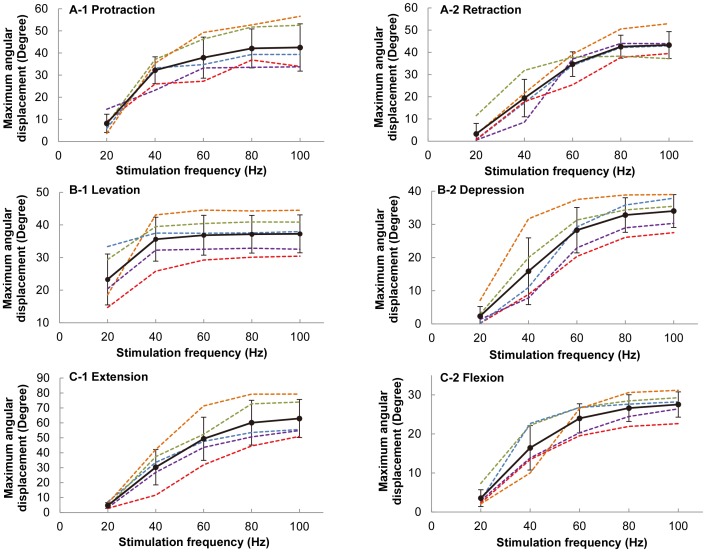
Figure 5. Maximum angular displacement as a function of stimulation frequency for all six motion types.
(A) protraction/retraction, (B) levation/depression, and (C) extension/flexion elicited at stimulation frequencies ranging from 20 to 100 Hz at step increments of 20 Hz. The different colors of dotted lines indicate different beetles used in the experiments. The thick black line represents the average maximum angular displacement (absolute values used for all the motions) at various stimulation frequencies (number of beetles = 5, number of data points at each stimulation frequency = 25 for each motion type).

