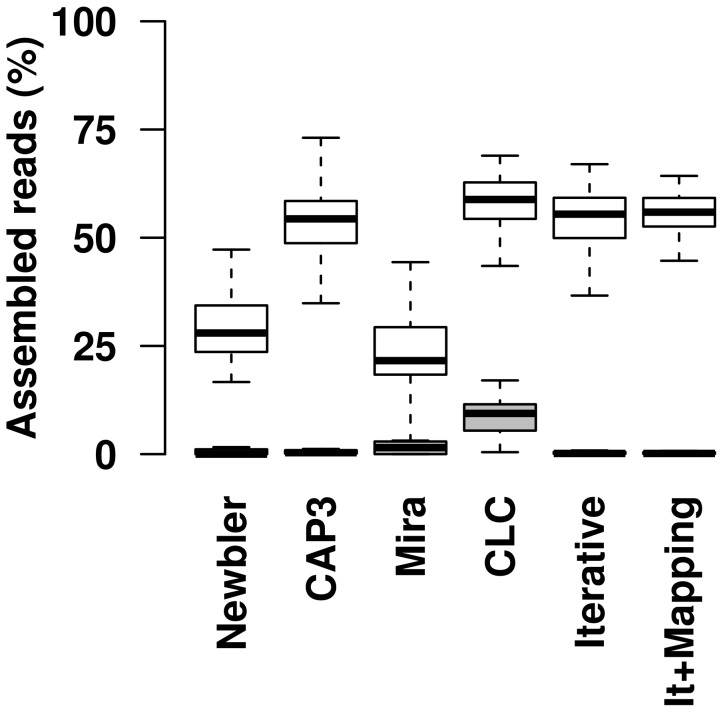
Figure 2. Assembly efficiency of different alignments strategies.
“Newbler”, “CAP3”, “Mira”, “CLC” indicate single rounds of de novo assembly with the respective assembler as described in Material and Methods. “Iterative” and “It+Mapped” indicates the assembly strategy applied in this study, without and with mapping of the trimmed reads to the taxonomic units after convergence of the assembly. White: Box plots of the percentage of assembled reads based on swab mucosa samples (nose and eye) of 78 caribou from Alaska, USA. Grey: Box plots of the percentage of assembled reads from 13 simulated metagenomic dataset containing non-overlapping reads (negative controls). Top and bottom of the box indicate the first and third quantile, the band inside the box marks the median. Whiskers extend to the upper and lower quartiles, and outliers are plotted as individual points.

