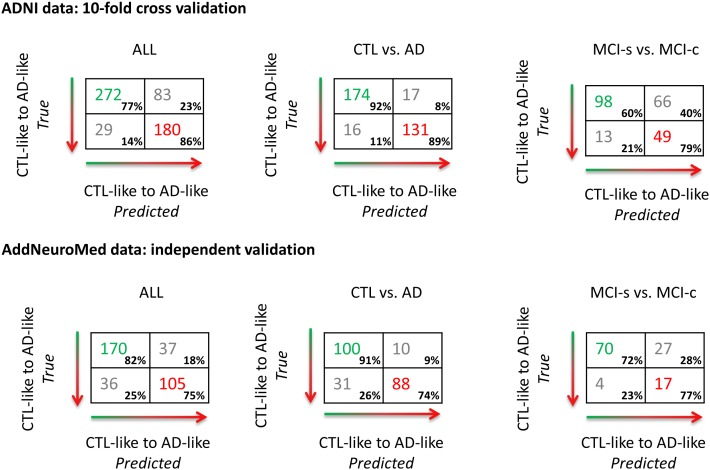
Figure 1. Confusion matrices for ordinal regression applied to two AD-related cohorts.
The confusion matrix for the binarised CTL-like vs. AD-like (CTL and MCI-s vs. MCI-c and AD) is displayed on the left. For illustration purposes, on the right confusion matrices for two contrasts of interest: CTL vs. AD and MCI-s vs. MCI-c (note: training scheme is unchanged). The top panel displays the results achieved using 10-fold cross-validation on the ADNI dataset. The bottom panel displays the results achieved by applying the ordinal regression model trained on the ADNI dataset to the AddNeuroMed data set whereby the AddNeuroMed dataset represents an independent unseen validation of the performance of the method.

