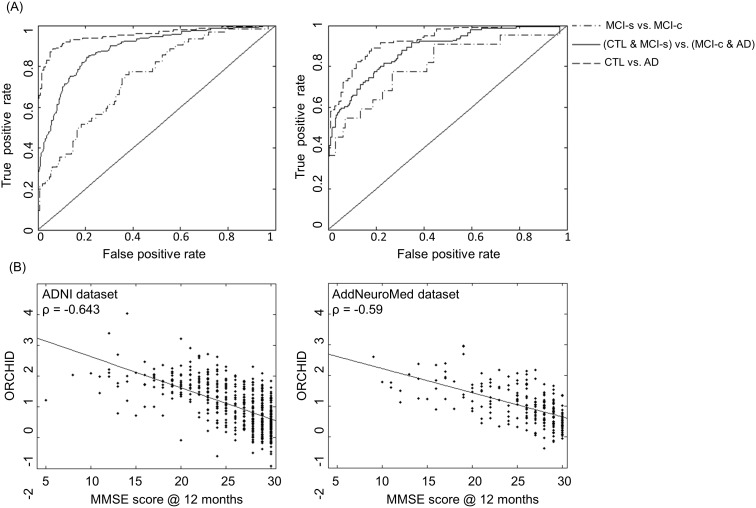
Figure 2. Performance curves and correlation plots for ordinal regression.
(A): ROC curves for ordinal regression applied to the ADNI data set using 10-fold cross-validation (first panel) and using the AddNeuroMed data set as an independent test set. In both cases the ROC curves are shown from three contrasts. (B): Correlation plots of the MMSE score assessed at the 12 month follow-up against the Ordinal Regression Characteristic Index of Dementia (ORCHID) score for both the ADNI dataset and the AddNeuroMed dataset.

