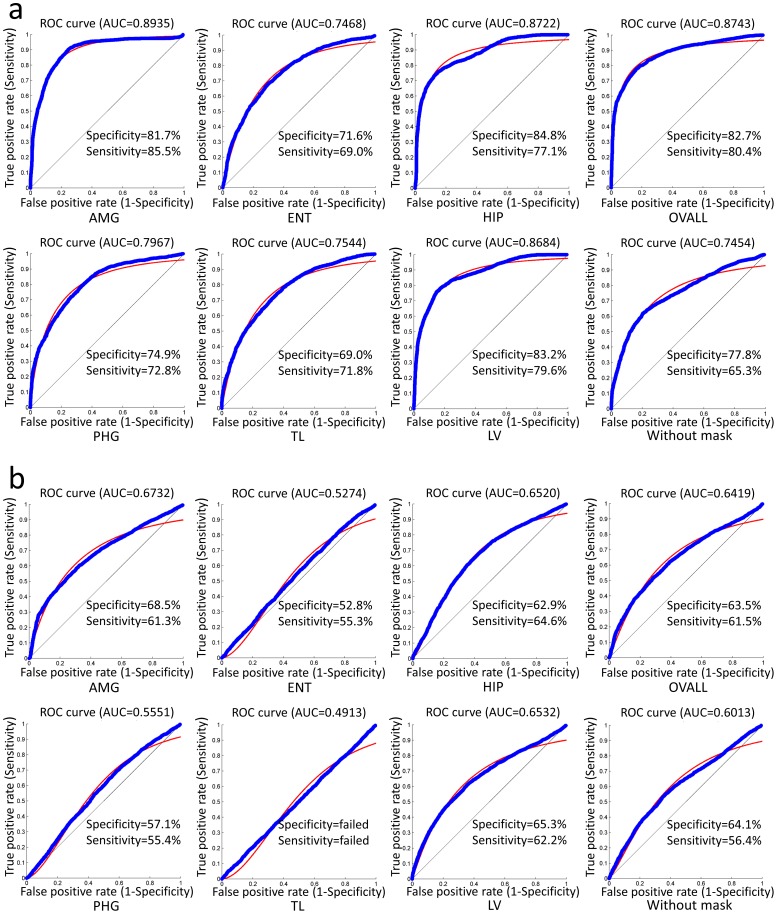
Figure 5. Classification performances with respect to features selected by seven masks in differentiating a) AD from NC, and b) MCI from NC.
The performances were measured in terms of specificity, sensitivity, and AUC. The ROC curves are also displayed in the blue color with a smooth fitting line shown in red.

