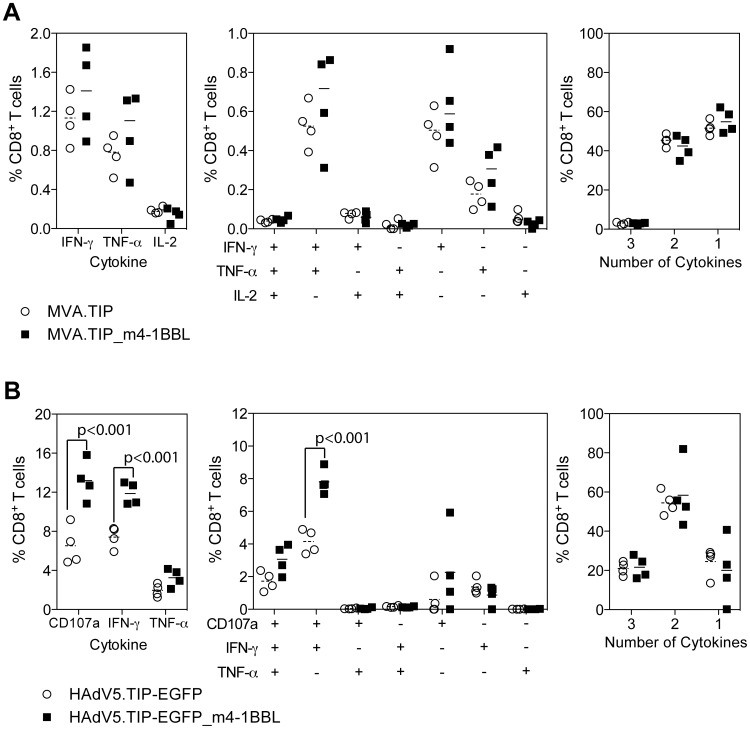
Figure 3. Quality of the CD8+ T cell response.
Balb/c mice immunised id with 106 MVA.TIP Adjuvant (A) or 108iu HAdV5.TIP-EGFP Adjuvant (B) and the response measured by intracellular cytokine staining after 6 hours or restimulation with Pb9 peptide. Graphs represent the total frequency of CD8+ T cells producing each cytokine (left), each combination of cytokines (central) or the percentage of cytokine producing cells secreting 3, 2 or 1 cytokine (right). For all graphs bars represent the median, with each individual animal displayed as a single point. Each data set was analyzed with a 2-way analysis of variance and a post-hoc Bonferroni test; p values denote the level of statistical significance.

