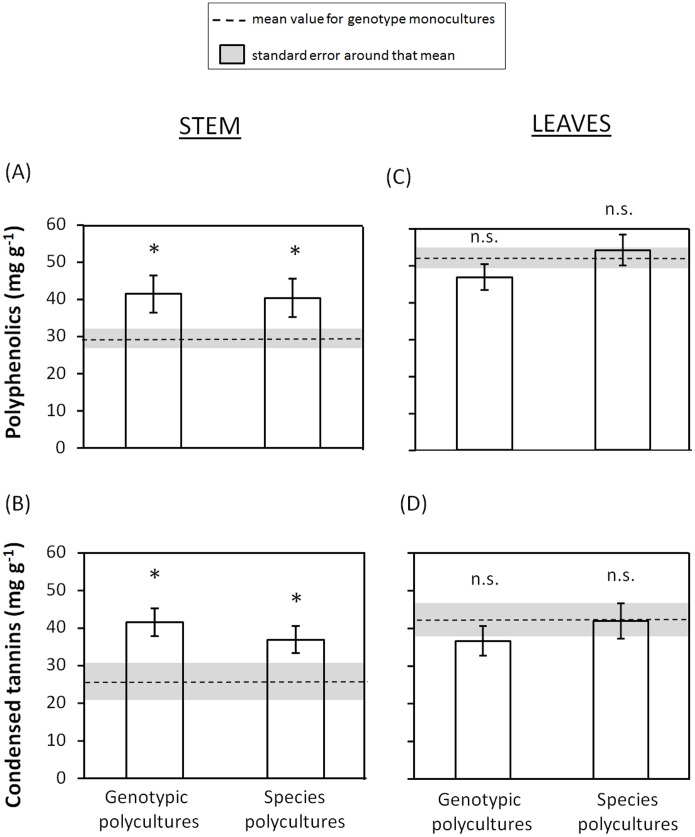
Figure 3. Diversity effect on plant defenses.
Effect of mahogany genotypic and species diversity on the concentration of: (A) mahogany stem polyphenolics, (B) stem tannins, (C) leaf polyphenolics, and (D) leaf tannins. The dashed line represents the mean value for mahogany genotypic monocultures (N = 12) and the shaded area represents the standard error around that mean. Least-square means ± S.E. (N = 12 for genotypic polycultures and N = 12 for species polycultures). Significant differences (P<0.05) between a given diversity treatment and the genotypic monoculture treatment are indicated by an asterisk.

