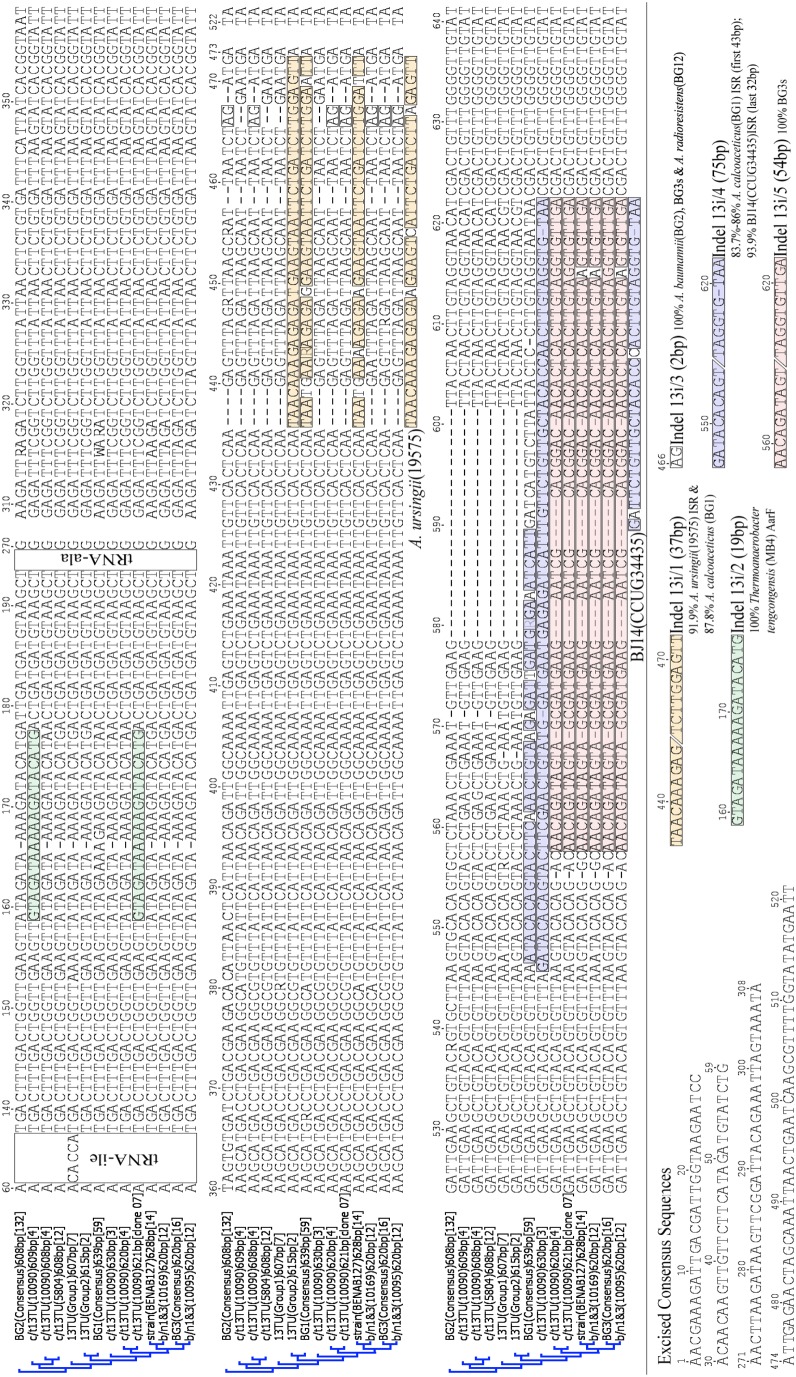
Figure 3. ITS consensus sequence alignments of Acb members including c/t13TU and Acinetobacter b/t 1 & 3 strains.
For each indel, coloured bars are shown below and behind each sequence in the alignment, and closest Blast match listed below its name. Number of sequences used for each in [ ]. Sequences conserved for all species are shown as grey bars, and single nucleotide differences within as vertical lines coloured red (T), blue (C), green (A), black (G) and grey (N). Numbers at branch nodes are % consensus support using HKY genetic distance, neighbor joining tree and bootstrap resampling 100 replicates. A. calcoaceticus (pink), A. baumannii (yellow), A. pittii (green) and A. nosocomialis (blue) sequences are labelled BG1, BG2, BG3 and 13TU respectively.

