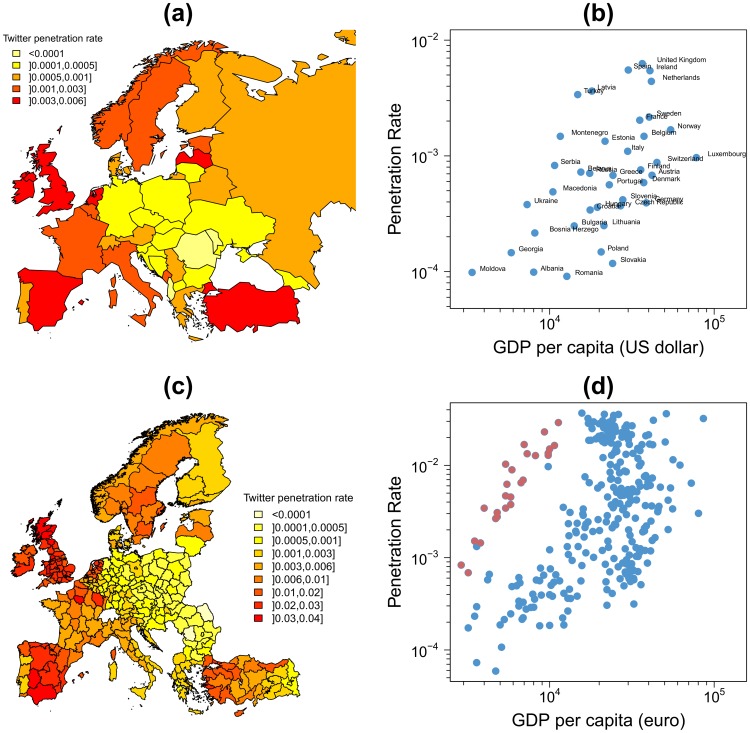
Figure 3. Twitter penetration rate across Europe.
(a) and (c) Geolocated Twitter penetration rate across Europe at country level (a) and NUTS 2 level (c). Twitter penetration rate is defined as the ratio between the number of users emitting geo-located tweets in our database and the population in 2012. (b) and (d) Penetration rate as a function of the Gross Domestic Product (GDP) per capita at country level (b) and NUTS 2 level (d). At country level, the figures for the GDP were obtained from the web of the International Monetary Fund [30], correspond to the year 2012 and are expressed in US dollars. At NUTS 2 level, the figures for the GDP were obtained from the web of Eurostat [32], the figures for GDP correspond to the year 2011 and are expressed in euros. Each point represents a country or a NUTS, the red points in (d) represent the NUTS 2 of Turkey.

