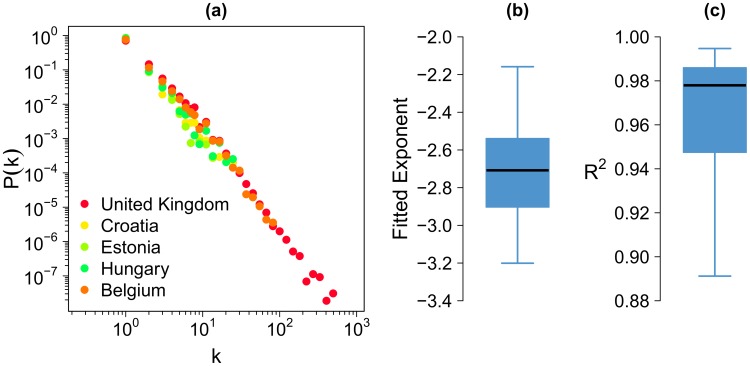
Figure 4. Distribution of the social network's degree.
(a) Probability distribution of number of ties of an individual in the social network of 5 countries drawn at random among the 39 case studies. (b) Box plot of the 39 fitted exponent values. (c) Box plot of the R 2 values. The box plot is composed of the minimum value, the lower hinge, the median, the upper hinge and the maximum value.

