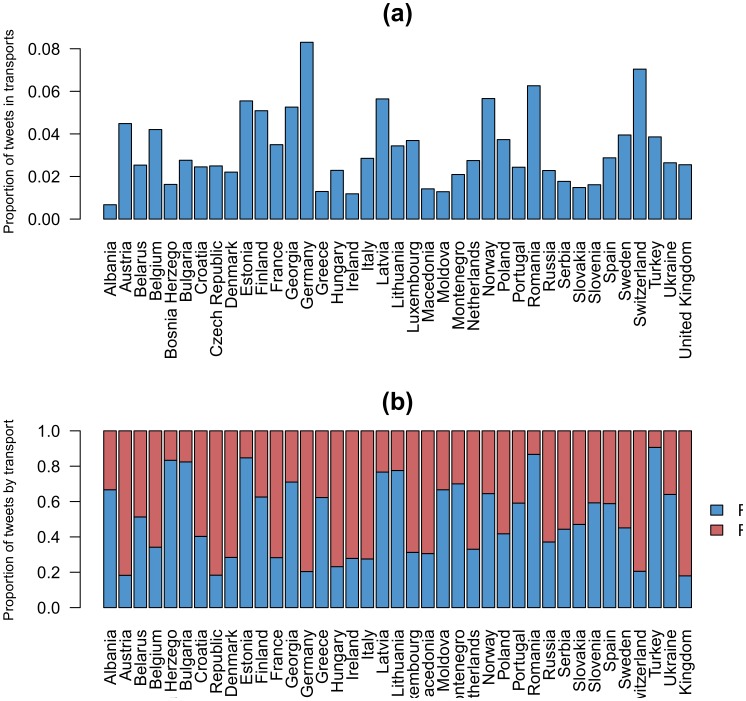
Figure 8. Proportion of tweets in transports.
(a) Proportion of tweets on the highway or railway networks by European countries. (b) Proportion of tweets according to the transport network by European countries. The blue color represents the tweets on the road. The red color represents the tweets on the rail. The proportions have been normalized in order to obtain a total proportion of tweets in transport equal to 1.

